

Evolution of proteomes: fundamental signatures and global trends in amino acid compositions
- PMID: 17147802
- PMCID: PMC1764020
- DOI: 10.1186/1471-2164-7-307
Evolution of proteomes: fundamental signatures and global trends in amino acid compositions
Abstract
Background: The evolutionary characterization of species and lifestyles at global levels is nowadays a subject of considerable interest, particularly with the availability of many complete genomes. Are there specific properties associated with lifestyles and phylogenies? What are the underlying evolutionary trends? One of the simplest analyses to address such questions concerns characterization of proteomes at the amino acids composition level.
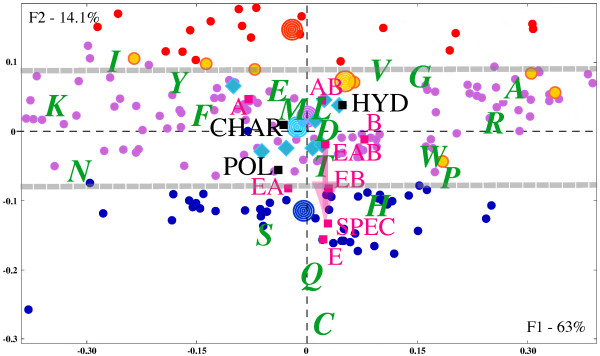
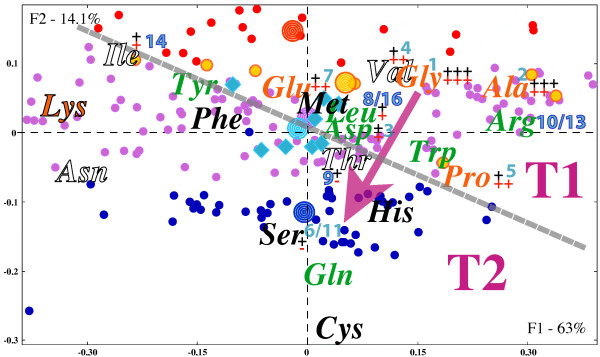
Results: In this work, amino acid compositions of a large set of 208 proteomes, with significant number of representatives from the three phylogenetic domains and different lifestyles are analyzed, resorting to an appropriate multidimensional method: Correspondence analysis. The analysis reveals striking discrimination between eukaryotes, prokaryotic mesophiles and hyperthemophiles-themophiles, following amino acid usage. In sharp contrast, no similar discrimination is observed for psychrophiles. The observed distributional properties are compared with various inferred chronologies for the recruitment of amino acids into the genetic code. Such comparisons reveal correlations between the observed segregations of species following amino acid usage, and the separation of amino acids following early or late recruitment.
Conclusion: A simple description of proteomes according to amino acid compositions reveals striking signatures, with sharp segregations or on the contrary non-discriminations following phylogenies and lifestyles. The distribution of species, following amino acid usage, exhibits a discrimination between [high GC]-[high optimal growth temperatures] and [low GC]-[moderate temperatures] characteristics. This discrimination appears to coincide closely with the separation of amino acids following their inferred early or late recruitment into the genetic code. Taken together the various results provide a consistent picture for the evolution of proteomes, in terms of amino acid usage.
Figures


Similar articles
-
Amino acid composition of genomes, lifestyles of organisms, and evolutionary trends: a global picture with correspondence analysis.Gene. 2002 Sep 4;297(1-2):51-60. doi: 10.1016/s0378-1119(02)00871-5. Gene. 2002. PMID: 12384285
-
GC content-independent amino acid patterns in bacteria and archaea.J Basic Microbiol. 2012 Apr;52(2):195-205. doi: 10.1002/jobm.201100067. Epub 2011 Jul 21. J Basic Microbiol. 2012. PMID: 21780150
-
A universal trend of amino acid gain and loss in protein evolution.Nature. 2005 Feb 10;433(7026):633-8. doi: 10.1038/nature03306. Epub 2005 Jan 19. Nature. 2005. PMID: 15660107
-
On the origin of genomic adaptation at high temperature for prokaryotic organisms.Biochem Biophys Res Commun. 2005 May 13;330(3):629-32. doi: 10.1016/j.bbrc.2005.02.134. Biochem Biophys Res Commun. 2005. PMID: 15809043 Review.
-
CvP-bias as an index to predict the life style of last common ancestor.J Biomol Struct Dyn. 2006 Apr;23(5):555-8. doi: 10.1080/07391102.2006.10507080. J Biomol Struct Dyn. 2006. PMID: 16494505 Review.
Cited by
-
Temperature adaptation at homologous sites in proteins from nine thermophile-mesophile species pairs.Genome Biol Evol. 2010 Jul 12;2:267-76. doi: 10.1093/gbe/evq017. Genome Biol Evol. 2010. PMID: 20624731 Free PMC article.
-
Global Shifts in Genome and Proteome Composition Are Very Tightly Coupled.Genome Biol Evol. 2015 May 13;7(6):1519-32. doi: 10.1093/gbe/evv088. Genome Biol Evol. 2015. PMID: 25971281 Free PMC article.
-
Detection and characterization of megasatellites in orthologous and nonorthologous genes of 21 fungal genomes.Eukaryot Cell. 2013 Jun;12(6):794-803. doi: 10.1128/EC.00001-13. Epub 2013 Mar 29. Eukaryot Cell. 2013. PMID: 23543670 Free PMC article.
-
Phenotypic response of yeast metabolic network to availability of proteinogenic amino acids.Front Mol Biosci. 2022 Aug 22;9:963548. doi: 10.3389/fmolb.2022.963548. eCollection 2022. Front Mol Biosci. 2022. PMID: 36072429 Free PMC article.
-
Bayesian prediction of bacterial growth temperature range based on genome sequences.BMC Genomics. 2012;13 Suppl 7(Suppl 7):S3. doi: 10.1186/1471-2164-13-S7-S3. Epub 2012 Dec 13. BMC Genomics. 2012. PMID: 23282160 Free PMC article.
References
Publication types
MeSH terms
Substances
LinkOut - more resources
Full Text Sources
Miscellaneous
