Community response to enrichment is highly sensitive to model structure
- PMID: 17148115
- PMCID: PMC1629049
- DOI: 10.1098/rsbl.2004.0246
Community response to enrichment is highly sensitive to model structure
Abstract
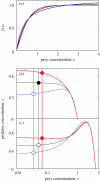
Biologists use mathematical functions to model, understand and predict nature. For most biological processes, however, the exact analytical form is not known. This is also true for one of the most basic life processes: the uptake of food or resources. We show that the use of several nearly indistinguishable functions, which can serve as phenomenological descriptors of resource uptake, may lead to alarmingly different dynamical behaviour in a simple community model. More specifically, we demonstrate that the degree of resource enrichment needed to destabilize the community dynamics depends critically on the mathematical nature of the uptake function.
Figures


References
-
- Armstrong R.A. The effects of predator functional response and prey productivity on predator–prey stability: a graphical approach. Ecology. 1976;57:609–612.
-
- Edelstein-Keshet L. McGraw-Hill; New York: 1988. Mathematical models in biology.
-
- Gilpin M.E. Enriched predator–prey systems: theoretical stability. Science. 1972;177:902–904. - PubMed
-
- Gross T, Ebenhöh W, Feudel U. Enrichment and food-chain stability: the impact of different forms of predator–prey interaction. J. Theor. Biol. 2004;227:349–358. - PubMed
-
- Holling C.S. The components of predation as revealed by a study of small-mammal predation of the European pine sawfly. Can. Entomol. 1959;91:293–320.
MeSH terms
LinkOut - more resources
Full Text Sources

