. 2007 Apr 1;109(7):2679-87.
doi: 10.1182/blood-2006-09-047704.

Development of the hemangioblast defines the onset of hematopoiesis in human ES cell differentiation cultures

Affiliations

Development of the hemangioblast defines the onset of hematopoiesis in human ES cell differentiation cultures

Marion Kennedy et al. Blood. .

Abstract

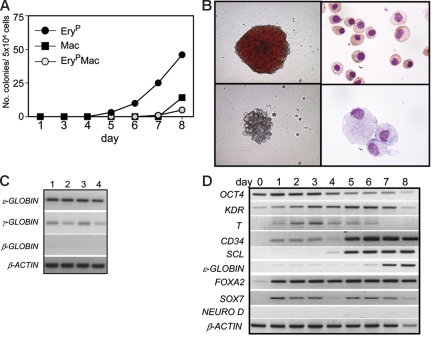
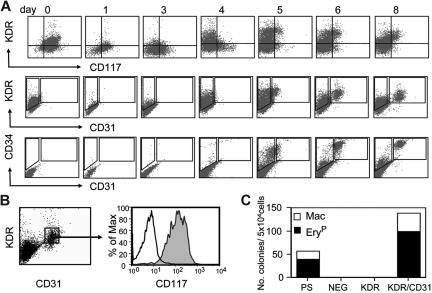
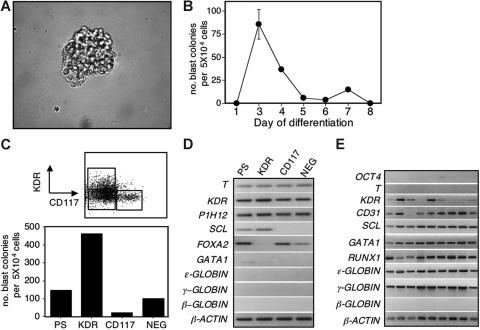
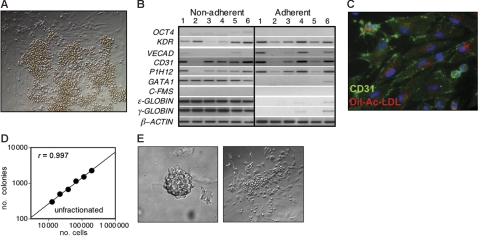
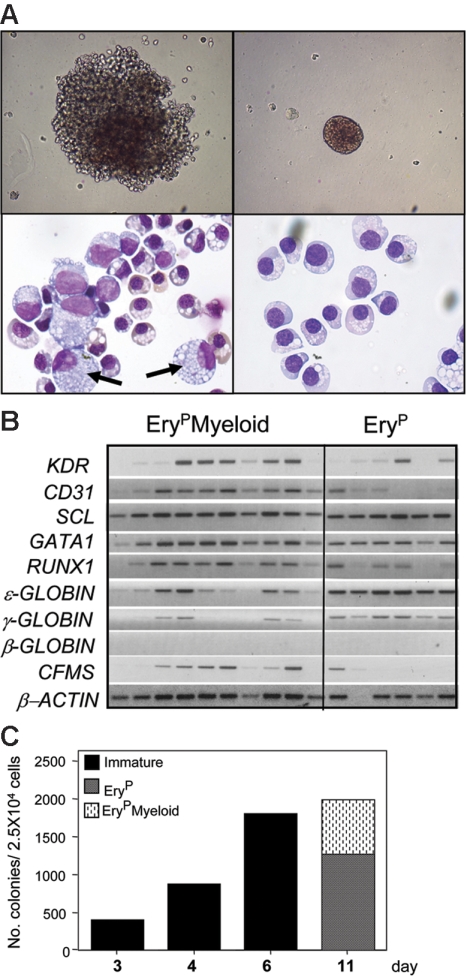
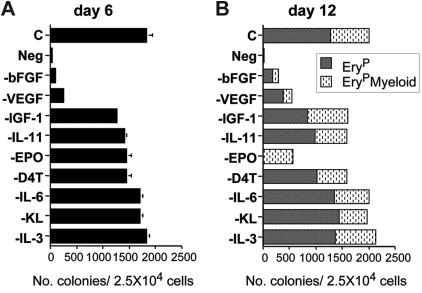
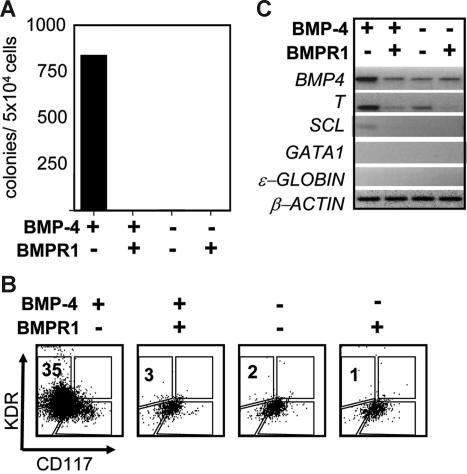
The onset of hematopoiesis in the mouse embryo and in the embryonic stem (ES) cell differentiation model is defined by the emergence of the hemangioblast, a progenitor with both hematopoietic and vascular potential. While there is evidence for the existence of a hemangioblast in the mouse, it is unclear if this progenitor develops during the establishment of the human hematopoietic system. In this report, we have mapped hematopoietic development in human ES cell (hESC) differentiation cultures and demonstrated that a comparable hemangioblast population exists. The human hemangioblasts were identified by their capacity to generate blast colonies that display both hematopoietic and vascular potential. These colony-forming cells express the receptor tyrosine kinase KDR (VEGF receptor 2) and represent a transient population that develops in BMP-4-stimulated embryoid bodies (EBs) between 72 and 96 hours of differentiation, prior to the onset of the primitive erythroid program. Two distinct types of hemangioblasts were identified, those that give rise to primitive erythroid cells, macrophages, and endothelial cells and those that generate only the primitive erythroid population and endothelial cells. These findings demonstrate for the first time the existence of the human hemangioblast and in doing so identify the earliest stage of hematopoietic commitment.


Figures

Figure 1
Figure 1
Kinetics of primitive hematopoietic development in human EBs. (A) Kinetics of hematopoietic development in H1 hESC-derived EBs. EBs were harvested on the indicated days, and the cells were dissociated and plated in methylcellulose supplemented with hematopoietic cytokines. EryP indicates colonies of primitive erythrocytes; Mac, colonies of macrophages; and EryPMac, mixed primitive erythroid/macrophage colonies. Bars indicating standard error of the mean number of colonies from 3 cultures are not visible. (B) The top row shows a primitive erythroid colony (left) and primitive erythrocytes (right), whereas the bottom row shows a macrophage colony (left) and macrophages (right). The primitive erythrocytes are from a pool of 10-day-old erythroid colonies generated from day-8 EBs. The macrophages are from the colony shown. Original magnification: for the colonies, × 400; for the cells, × 1000. (C) PCR analyses of 4 individual primitive erythroid colonies from day 8-EBs showing ϵ- and γ- but not β-globin expression. (D) Expression analyses of EBs at different stages of development. Numbers on top represent day of differentiation.
Figure 2
Figure 2
Surface marker expression on developing EBs. (A) Flow cytometric analyses of different aged EBs showing expression patterns of KDR, CD117, CD31, and CD34. (B) Coexpression of KDR, CD31, and CD117 on a subpopulation of day-8 EBs. Shaded histogram represents population stained with anti-CD117 antibody; open histogram is unstained control. (C) Hematopoietic progenitor potential of the presorted population (PS), and the CD31KDR (NEG), CD31KDR+ (KDR), and CD31+KDR+ (KDR/CD31) fractions isolated from day-8 EBs.
Figure 3
Figure 3
Blast cell colony development from human EBs. (A) Photograph of a 6-day-old blast colony generated from day-3 EBs. Original magnification × 400. (B) Kinetics of blast colony development in EBs generated from H1 ES cells. Bars, where visible, indicate standard error of the mean number of colonies from 3 cultures. (C) Blast colony–forming potential of the presorted population (PS) and the KDR+CD117 (KDR), KDRCD117+ (CD117), and KDRCD117 (NEG) populations isolated from day-3 EBs. Top figure shows the gates used to isolate the different fractions. Bottom figure indicates the blast colony potential of each of the fractions as well as of the PS population. Bars indicating standard error of the mean number of colonies from 3 cultures are not visible. (D) Expression analyses of the different fractions isolated in panel C. (E) Expression analyses of 9 individual 6-day-old blast colonies generated from KDR+ cells isolated from day-4 EBs.
Figure 4
Figure 4
Developmental potential of human blast colonies. (A) Photograph showing the adherent and nonadherent population generated from an individual 6-day-old blast colony plated on a thin layer of matrigel in media containing both hematopoietic and endothelial cytokines. (B) Expression analyses of the nonadherent and adherent populations generated from 6 individual blast colonies. The colonies were grown from day-4 EB-derived KDR-positive cells. (C) Immunostaining and DiI-Ac-LDL uptake of adhesive cells generated from a single blast colony. CD31 expression is indicated by green fluorescence and LDL uptake by red fluorescence. Original magnification: × 400. (D) Cell dose-response showing the relationship between the number of day-4 EB cells plated and the number of blast colonies that develop. (E) Photograph of a blast colony generated from a single KDR+ cell and of the adherent and nonadherent populations generated from it. Single KDR+ cells from day-3 EBs were deposited into microtiter wells containing methylcellulose. After 6 days of culture, the colony was picked from the microtiter well and cultured on a thin layer of matrigel for an additional 6 days. Original magnification for the colony and expanded populations: × 400.
Figure 5
Figure 5
Development of 2 populations of hemangioblasts. (A, top row) Photograph of an 11-day-old EryPMyeloid–restricted (left) and EryP-restricted (right) blast colony (original magnification, × 200). (A, bottom row, left) Photograph of erythrocytes and macrophages (arrows) from an individual EryPMyeloid blast colony, and (right) erythroid cells from a pool of EryP blast colonies. Original magnification: × 1000. (B) Expression analyses of 10 individual EryPMyeloid and 6 EryP blast colonies. (C) Kinetics of blast colony development from KDR+ cells isolated from day-4 EBs.
Figure 6
Figure 6
Cytokine regulation of hemangioblast growth and differentiation. (A) The effect of removing individual factors from the blast colony methylcellulose cultures on the number of immature blast colonies that develop at day 6. (B) The numbers of EryP and EryPMyeloid blast colonies that develop on day 12 of culture.
Figure 7
Figure 7
BMP-4 requirement for hemangioblast development. (A) Blast colony potential of day 4-EBs induced in the presence and absence of BMP-4 and soluble BMP-4 receptor (sBMP4R-lA, sBMP4R-lB, 250 ng/mL). The presence and absence of factor and receptor are indicated below the graph. (B) Flow cytometric analysis showing KDR and CD117 expression of the 4 different EB populations. (C) RT–PCR expression analyses of the same EB populations analyzed in panel A.

References

    1. Haar JL, Ackerman GA. A phase and electron microscopic study of vasculogenesis and erythropoiesis in the yolk sac of the mouse. Anat Rec. 1971;170:199–224. - PubMed
    1. Palis J, McGrath KE, Kingsley PD. Initiation of hematopoiesis and vasculogenesis in murine yolk sac explants. Blood. 1995;86:156–163. - PubMed
    1. Palis J, Roberston S, Kennedy M, Wall C, Keller G. Development of erythroid and myeloid progenitors in the yolk sac and embryo proper of the mouse. Development. 1999;126:5073–5084. - PubMed
    1. Sabin FR. Studies on the origin of blood vessels and of red corpuscles as seen in the living blastoderm of the chick during the second day of incubation. Contrib Embryol. 1920;9:213–262.
    1. Murray PDF. The development in vitro of the blood of the early chick embryo. Proc Royal Soc London. 1932;11:497–521.

Publication types

MeSH terms

Substances