. 2007 Apr 1;109(7):2878-86.
doi: 10.1182/blood-2006-07-037754.

Interleukin 2 gene transcription is regulated by Ikaros-induced changes in histone acetylation in anergic T cells

Affiliations

Interleukin 2 gene transcription is regulated by Ikaros-induced changes in histone acetylation in anergic T cells

Sanmay Bandyopadhyay et al. Blood. .

Abstract

In T cells anergy may be evoked by an unbalanced stimulation of the T-cell receptor in the absence of costimulation. Anergic T cells are unresponsive to new antigen receptor engagement and do not produce interleukin 2. We present evidence that anergizing stimuli induce changes in histone acetylation, which mediates transcriptional repression of interleukin 2 expression. In response to calcium signaling, anergic T cells up-regulate the expression of Ikaros, a zinc finger transcription factor essential for lymphoid lineage determination. Ikaros binds to the interleukin 2 promoter where it induces histone deacetylation. Confirming the role of Ikaros in the induction of T-cell anergy, cells with reduced Ikaros activity show defective inactivation in response to an anergizing stimulus. We propose a model in which tolerizing stimuli induce epigenetic changes on the interleukin 2 locus that are responsible for the stable inhibition of the expression of this cytokine in anergic T cells.


Figures
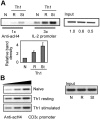
Figure 1
Figure 1
T-cell stimulation induces hyperacetylation of the il2 promoter. ChIP assays were performed using antiacetylated H4 antibodies in naive (N) and in Th1 cells resting (R) or stimulated (St) for 6 hours with anti-CD3 and anti-CD28. PCR amplifications with primers for the (A) il2 or the (B) CD3ϵ promoters were done with different amounts of sample to confirm linearity of the amplification. One experiment of 2 with similar results is shown. Numbers below input bands indicate relative (to naive cells) amount quantified using qPCR. Graph shows relative (to naive cells) intensity of amplified complexes from all experiments (mean + SEM).
Figure 2
Figure 2
Anergizing stimuli induce H4 deacetylation of the il2 promoter in anergic Th1 cells. (A) Th1 cells were treated with 1 μM ionomycin (Iono) for 16 hours and analyzed by intracellular IL-2 staining following stimulation with anti-CD3 and anti-CD28. (B) Th1 cells were anergized with plate-bound anti-CD3 and, after a 3-day resting period, stimulated with anti-CD3 and anti-CD28. IL-2 expression (ELISA) and BrdU incorporation were measured. Error bars show mean ± SEM of 3 experiments. (C) ChIP assays were performed with antiacetylated H4 antibodies to assess acetylation of the il2 promoter. Control cells were analyzed and compared with cells anergized using either ionomycin (Iono) or anti-CD3. In some cells, TSA (10 nM) was added together with ionomycin to inhibit the activity of HDACs. Experiments were also performed with a control IgG. PCR products are shown for precipitated fractions and sample inputs. One experiment of 4 is shown. Numbers below input bands indicate relative amount (to control cells) quantified using qPCR. Graph shows relative intensity of immunoprecipitated complexes from all experiments (mean + SEM). (D) ChIP experiments were performed in control (Ctrl) and anergized (Iono) cells (± TSA) using anti-H4 antibodies. PCR reactions were carried out with different amounts of sample (2-fold increases) to confirm linearity of the amplification. (E) Samples from panels C and D were also analyzed using primers for the CD3ϵ promoter. (F) Th1 cells were anergized by stimulation with anti-CD3 for 16 hours in the presence or the absence of TSA, washed, and left resting for 3 days. After that, ChIP assays were performed using antiacetylated H4 antibodies and primers specific for the IL-2 promoter. The gels show PCR amplifications of 3 different amounts of chromatin (2-fold increases) for the anti-CD3–treated and control cells. PCR amplifications of the inputs from the different samples are also shown. (G) Control cells or cells anergized with ionomycin were restimulated with anti-CD3 and anti-CD28 for 6 hours and then used to immunoprecipitate chromatin complexes using an antiacetylated H4 antibody. Amplified products from different amounts of each sample (2-fold increases) and from the different inputs are shown.
Figure 3
Figure 3
HDAC inhibition interferes with IL-2 expression blockade in anergic Th1 cells. (A) Th1 cells were treated with ionomycin in the presence or absence of TSA. Untreated and TSA-treated cells were used as controls. After a 16-hour treatment, cells were allowed to rest for 4 hours and then restimulated with anti-CD3 and anti-CD28 (right) or PMA and ionomycin (left). IL-2 production was determined by ELISA. Bars show mean + SEM of 3 experiments. (B) After a 16-hour treatment with ionomycin, Th1 cells were allowed to rest for 4 hours and then restimulated with anti-CD3 and anti-CD28 in the presence or absence of TSA. IL-2 production was measured by ELISA. Graphs show either IL-2 values from one representative experiment (mean + SEM from 3 different samples per condition; left) or IL-2 production relative to control stimulated Th1 cells from 4 independent experiments (mean + SEM; right).
Figure 4
Figure 4
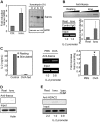
Calcium signaling induces increased expression and binding of Ikaros to the il2 promoter in anergic Th1 cells. (A) Th1 cells were treated with ionomycin (Iono) for 6 hours and the expression of Ikaros mRNA was measured by qPCR compared with resting cells (Ctrl). Graph shows mean + SEM of 3 independent experiments. Ikaros expression was also determined by Western blot. Anti–mouse β-actin antibodies were used to control loading. (B) In vivo binding of Ikaros to the il2 promoter in anergic Th1 cells was determined by ChIP using anti-Ikaros antibodies and primers for the il2 promoter on ionomycin-treated (Iono) and control resting (Rest) Th1 cells. ChIPs were also performed with a control IgG. PCR products are shown for precipitated fractions and sample inputs. One experiment of 4 with similar results is shown. Numbers below input bands represent relative amount (to control cells) quantified using qPCR. Reactions were carried out with 3 different amounts of sample (2-fold increases) to confirm linearity of the amplification. Graph shows relative band (to control cells) intensity of immunoprecipitated complexes from all experiments (mean + SEM). (C) CD4+ T cells from DO11.10 mice were isolated from OVA-fed mice and age- and sex-matched PBS-fed controls. Anergy was assessed by ELISA following stimulation with anti-CD3 and anti-CD28. Bars show mean + SEM of 3 different experiments. Chromatin complexes were immunoprecipitated using an anti-Ikaros antibody. PCR products using primers for the il2 promoter are shown for the precipitated fraction and the sample inputs. Gel shows one experiment of 4 with similar results. Numbers below input bands represent relative amount (to the value in PBS-fed mice) quantified using qPCR. Reactions were carried out with different amounts of immunoprecipitated sample (2-fold increases) to confirm linearity of the amplification. Graph shows relative intensity of immunoprecipitated complexes from 4 different sets of mice (mean + SEM). *P < .02 when comparing band intensities from PBS- and OVA-fed mice using a t test. (D) Samples from panel B were analyzed using primers for mouse actin. (E) ChIP assays were performed using anti–mouse HDAC2 antibodies on samples prepared from resting (Rest) Th1 cells or cells treated with ionomycin (Iono) ± TSA. Samples were amplified with primers for the il2 promoter. Gel shows 1 of 3 experiments. Numbers below input bands represent relative amount (to the value in resting cells) quantified using qPCR.
Figure 5
Figure 5
Binding of Ikaros to the il2 promoter induces H4 deacetylation and inhibits il2 expression. (A) Jurkat cells were transfected with an il2–luciferase reporter plasmid and increasing amounts of an Ikaros expression plasmid. Twenty-four hours after transfection, cells were stimulated with PMA and ionomycin, and luciferase activity was determined. (B) Western blot using an anti-Ikaros antibody was performed with samples from RV-GFP–infected control resting (C) and ionomycin-treated (Io) cells and cells infected with RV-Ikaros-IRES-GFP (Ik). Infected cells were stimulated with anti-CD3 and anti-CD28 for 24 hours and IL-2 expression determined by ELISA. Bars show mean + SEM of 3 independent experiments. (C) Th1 cells transduced with virus expressing HA-Ikaros (Ik) and GFP or control GFP-virus were sorted and ChIPs performed using an anti-HA antibody. PCR products amplified with primers for the il2 promoter are shown for immunoprecipitated complexes and inputs. Gel shows one of 3 experiment with similar results. Numbers below input bands represent relative amount (to the value in RV-GFP–infected cells) quantified using qPCR. Graph shows relative band intensity (to the intensity in GFP-infected control cells) of immunoprecipitated complexes from all experiments (mean + SEM). (D) ChIP assays were performed using an antiacetylated H4 antibody on samples from transduced Th1 cells expressing GFP or HA-Ikaros and GFP (Ik). PCR products amplified with primers for the il2 promoter are shown for immunoprecipitated complexes and inputs. One experiment of 3 with similar results is shown. Numbers below input bands represent relative amount (to the value in RV-GFP–infected cells) quantified using qPCR. Graph shows relative band intensity of amplified immunoprecipitated complexes from all experiments (mean + SEM). Samples were also amplified using primers for the CD3ϵ promoter. (E) Infected Th1 cells with retroviruses expressing either GFP (control) or Ikaros and GFP (Ikaros) were treated with TSA from day 2 after infection. Four days later, cells were stimulated with anti-CD3 and anti-CD28 for 24 hours and IL-2 expression was determined by ELISA. Bars show mean + SEM of 3 different samples.
Figure 6
Figure 6
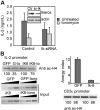
Inhibition of Ikaros activity results in defective anergy induction and il2 promoter deacetylation in Th1 cells. (A) Th1 cells were transfected with the pSUPER-IK-19i vector (Ik-siRNA) or empty pSUPER (Control) and pGFP. After 36 hours, GFP+ sorted cells were treated with or without ionomycin (Iono) and stimulated with anti-CD3 and anti-CD28. IL-2 production was determined by EILSA. Bars show mean + SEM of 3 different experiments. Following ionomycin treatment, Ikaros levels from both cell populations were measure by Western blot. Blots were also probed with antiactin antibody to control loading. (B) ChIP assays were performed on Th1 cells transduced with virus expressing GFP or Ikaros-6 and GFP (Ik6) and sorted for GFP expression. Cells were rested or treated with ionomycin (Io). Samples precipitated with an antiacetylated H4 antibody were amplified with primers for the il2 promoter. Products are shown for precipitated complexes and inputs. One experiment of 2 is shown. Numbers below bands represent relative intensity (to RV-GFP–infected cells). Precipitated complexes were also amplified using primers for the CD3ϵ promoter. Anergy induction in sorted cells was also analyzed by ELISA following stimulation with anti-CD3 and anti-CD28. Bars show mean + SEM of the anergy index value (ratio of IL-2 produced by control cells and anergized cells) of 2 different experiments performed in triplicate.

References

    1. Abbas AK. The control of T cell activation vs tolerance. Autoimmun Rev. 2003;2:115–118. - PubMed
    1. Gimmi CD, Freeman GJ, Gribben JG, Gray G, Nadler LM. Human T-cell clonal anergy is induced by antigen presentation in the absence of B7 costimulation. Proc Natl Acad Sci U S A. 1993;90:6586–6590. - PMC - PubMed
    1. Jenkins MK, Chen CA, Jung G, Mueller DL, Schwartz RH. Inhibition of antigen-specific proliferation of type 1 murine T cell clones after stimulation with immobilized anti-CD3 monoclonal antibody. J Immunol. 1990;144:16–22. - PubMed
    1. Quill H, Schwartz RH. Stimulation of normal inducer T cell clones with antigen presented by purified Ia molecules in planar lipid membranes: specific induction of a long-lived state of proliferative nonresponsiveness. J Immunol. 1987;138:3704–3712. - PubMed
    1. Perez VL, Van Parijs L, Biuckians A, Zheng XX, Strom TB, Abbas AK. Induction of peripheral T cell tolerance in vivo requires CTLA-4 engagement. Immunity. 1997;6:411–417. - PubMed

Publication types

MeSH terms