Comparative Study
. 2006 Dec 19;103(51):19535-40.
doi: 10.1073/pnas.0608492103. Epub 2006 Dec 5.

Synapse-specific regulation of AMPA receptor function by PSD-95

Affiliations
Comparative Study

Synapse-specific regulation of AMPA receptor function by PSD-95

Jean-Claude Béïque et al. Proc Natl Acad Sci U S A. .

Abstract

PSD-95 is a major protein found in virtually all mature excitatory glutamatergic synapses in the brain. Here, we have addressed the role of PSD-95 in controlling glutamatergic synapse function by generating and characterizing a PSD-95 KO mouse. We found that the alpha-amino-3-hydroxy-5-methylisoxazole-4-propionic acid (AMPA)subtype of glutamate receptor (AMPAR)-mediated synaptic transmission was reduced in these mice. Two-photon (2P) uncaging of MNI-glutamate onto individual spines suggested that the decrease in AMPAR function in the PSD-95 KO mouse stems from an increase in the proportion of "silent" synapses i.e., synapses containing N-methyl-d-aspartate (NMDA) receptors (NMDARs) but no AMPARs. Unexpectedly, the silent synapses in the KO mouse were located onto morphologically mature spines. We also observed that a significant population of synapses appeared unaffected by PSD-95 gene deletion, suggesting that the functional role of PSD-95 displays synapse-specificity. In addition, we report that the decay of NMDAR-mediated current was slower in KO mice: The contribution of NR2B subunit containing receptors to the NMDAR-mediated synaptic current was greater in KO mice. The greater occurrence of silent synapses might be related to the greater magnitude of potentiation after long-term potentiation induction observed in these mice. Together, these results suggest a synapse-specific role for PSD-95 in controlling synaptic function that is independent of spine morphology.


Conflict of interest statement

Conflict of interest statement: Under a licensing agreement between Upstate Group, Inc. and The Johns Hopkins University, R.L.H. is entitled to a share of royalties received by the University on sales of products described in this article. R.L.H. is a paid consultant to Upstate Group, Inc. The terms of this arrangement are being managed by The Johns Hopkins University in accordance with its conflict-of-interest policies.

Figures

Fig. 1.
Fig. 1.
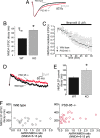
AMPAR-function is decreased in PSD-95−/− mice. (A) In A1, the AMPA/NMDA ratio was determined by subtracting the traces obtained in 100 μM D-L AP5 from those obtained in its absence (C + 1) and was found to be significantly lower (P < 0.05, Student's t test) in KO (n = 9) compared with WT (n = 5) mice. These results were obtained in age-matched littermates (P16–P20). In A2, the AMPA/NMDA ratio was calculated by estimating the respective AMPA (1) and NMDAR (2) current on the traces at +40 mV based on their different time courses (as depicted in the Inset). The AMPA/NMDA ratio was significantly lower (P < 0.01, Student's t test) in KO (n = 19) than in WT mice (n = 18). (B) The AMPA/NMDA ratios obtained by the method depicted in A2 are shown binned according to the age of the animals (P9–P12, P = 0.07, n = 5 each; P14–20, P < 0.05; n = 7 each; P21–P24, P < 0.05; n = 6 for WT and n = 7 for KO). (C) Frequency and amplitude of mEPSCs were binned according to the age of the animals. For the frequency of events: P8–P10, P = 0.3; n = 11 for WT and n = 4 for KO mice; P14–P20, P < 0.05; n = 10 for WT and n = 16 for KO mice; P21–P25, P < 0.05; n = 10 for WT and n = 8 for KO mice. For this and subsequent figures, an asterisk indicates statistical significance.
Fig. 2.
Fig. 2.
The electrophysiological response to 2P uncaging of MNI-GLU closely mimics that of endogenously released glutamate. (A) 2P image of a CA1 pyramidal neuron filled with 40 μM Alexa Fluor 594. (B) On this image of a spine, the yellow dot (Upper) represents the spot of laser illumination. (Lower) An averaged current trace depicting a 2P-EPSC induced by laser illumination is superimposed with an averaged mEPSC trace collected from the same neuron. (C) The laser spot was delivered at fixed spatial intervals (0.5 μm) around the spine and the amplitude (●; red trace) and rise time (○) of the 2P-EPSCs are plotted as a function of distance from the center of the spine. The intensity profile of the spine is depicted by the blue trace. (D) Traces depicting 2P-EPSCs while holding the cell at different voltages are shown. The peak amplitude of the 2P-EPSC is plotted as a function of the holding voltage. (E) Traces depicting 2P-EPSCs at −70 mV and +40 mV, elicited from the spine shown, are shown during baseline, after bath administration of NBQX (20 μM) and after the subsequent administration of DL-APV (100 μM). (F) On these two neighboring spines, displaying a characteristic thin profile, derived from a young (P8) rat, 2P uncaging elicited responses at +40 mV but not at −70 mV.
Fig. 3.
Fig. 3.
Analysis of glutamatergic synapses by 2P uncaging of MNI-GLU and analysis of spine morphology in PSD-95−/− mice. (A) Images of individual spines from WT and KO mice are shown with their respective 2P-EPSCs elicited at −70 and +40 mV. (B1) Distributions of 2P-AMPA/NMDA ratio onto individual spines are plotted for both WT and KO mice. (B2) Cumulative distribution plots of the ratios shown in B1. (C) The 2P-AMPAR/NMDAR ratio obtained from uncaging onto individual spines is plotted against the volume of those spines. (D) The average AMPAR/NMDAR ratio (WT, 1.13 ± 0.14, n = 20; KO, 0.63 ± 0.14, n = 26; P < 0.05) obtained for individual spines by 2P-uncaging is plotted on the y axis against the average volume of the spines (WT, 0.16 ± 0.02 μm3, n = 20; KO, 0.17 ± 0.02 μm3, n = 25; P = 0.7) onto which the AMPAR/NMDAR were determined. (E) The volumes of spines were determined from a much broader population than in D; WT, 0.17 ± 0.01 μm3, n = 271 spines, 7 cells, 4 mice; KO, 0.17 ± 0.01 μm3, n = 509 spines, 12 neurons, 5 mice).
Fig. 4.
Fig. 4.
Analysis of NMDAR function in PSD-95−/− mice. (A) Current traces showing NMDAR-mediated synaptic currents recorded in 10 μM glycine, 20 μM NBQX, and 0.1 mM Mg2+at −60 mV. (B) The decay kinetics of NMDAR-mediated synaptic currents were longer in KO mice (weighted time constants: WT, 75 ± 2 ms, n = 8; KO, 113 ± 7 ms, n = 8; P < 0.01). (C) The inhibition of NMDAR-mediated synaptic currents induced by ifenprodil (3 μM) was larger in KO mice (WT, n = 8; KO, n = 9; P < 0.05, unpaired Student's t test tested between 30 and 35 min). Stimulation frequency was 0.06 Hz. (D) Current traces showing mixed AMPA and NMDA currents elicited by 2P-uncaging of MNI-GLU recorded in normal Ringer solution while holding the cell at +40 mV in WT and KO mice. (E) The decay kinetics of the NMDAR portion of the mixed 2P-current was approximated by fitting a single exponential decay and was longer in KO mice (WT, 173 ± 13 ms, n = 20; KO, 250 ± 16 ms; n = 25; P < 0.01). (F) The decay kinetics of the NMDAR portion of the current induced by 2P-uncaging of MNI-GLU (as determined in E) is plotted against the 2P-AMPA/NMDA ratio obtained from the same spines (elicited following the same procedure as in Fig. 3).

Similar articles

Cited by

References

    1. Malenka RC, Nicoll RA. Science. 1999;285:1870–1874. - PubMed
    1. Kornau HC, Schenker LT, Kennedy MB, Seeburg PH. Science. 1995;269:1737–1740. - PubMed
    1. Hunt CA, Schenker LJ, Kennedy MB. J Neurosci. 1996;16:1380–1388. - PMC - PubMed
    1. Sheng M, Wyszynski M. BioEssays. 1997;19:847–853. - PubMed
    1. Kennedy MB. Trends Neurosci. 1997;20:264–268. - PubMed

Publication types

MeSH terms