. 2007 Feb;50(2):348-58.
doi: 10.1007/s00125-006-0490-2. Epub 2006 Dec 6.

MAFA controls genes implicated in insulin biosynthesis and secretion

Affiliations

MAFA controls genes implicated in insulin biosynthesis and secretion

H Wang et al. Diabetologia. 2007 Feb.

Abstract

Aims/hypothesis: Effects of the transcription factor v-maf musculoaponeurotic fibrosarcoma oncogene homologue A (MAFA) on the regulation of beta cell gene expression and function were investigated.

Materials and methods: INS-1 stable cell lines permitting inducible up- or downregulation of this transcription factor were established.

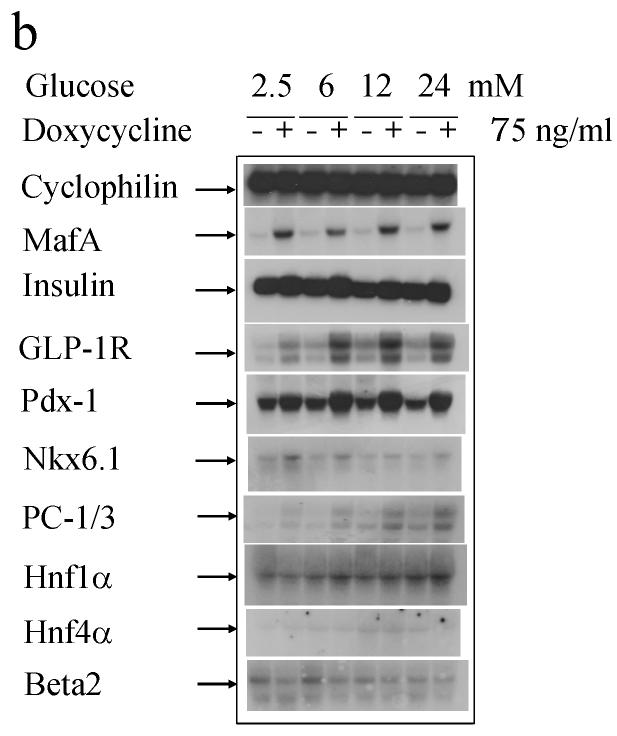
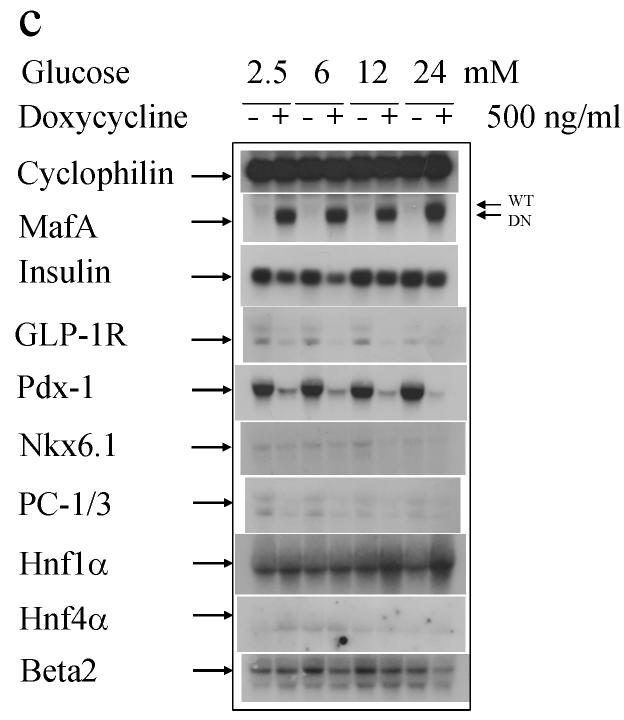
Results: MAFA overproduction enhanced and its dominant-negative mutant (DN-MAFA) diminished binding of the factor to the insulin promoter, correlating with insulin mRNA levels and cellular protein content. Glucose-stimulated insulin secretion was facilitated by MAFA and blunted by DN-MAFA. This is partly due to alterations in glucokinase production, the glucose sensor of beta cells. In addition, the expression of important beta cell genes, e.g. those encoding solute carrier family 2 (facilitated glucose transporter), member 2 (formerly known as GLUT2), pancreatic and duodenal homeobox factor 1 (PDX1), NK6 transcription factor-related, locus 1 (NKX6-1), glucagon-like peptide 1 receptor (GLP1R), prohormone convertase 1/3 (PCSK1) and pyruvate carboxylase (PC), was regulated positively by MAFA and negatively by DN-MAFA.

Conclusions/interpretation: The data suggest that MAFA is not only a key activator of insulin transcription, but also a master regulator of genes implicated in maintaining beta cell function, in particular metabolism-secretion coupling, proinsulin processing and GLP1R signalling. Our in vitro study provides molecular targets that explain the phenotype of recently reported Mafa-null mice. We also demonstrate that MAFA is produced specifically in beta cells of human islets. Glucose influenced DNA-binding activity of MAFA in rat islets in a bell-shaped manner. MAFA thus qualifies as a master regulator of beta-cell-specific gene expression and function.


Figures

Fig 1
Fig 1
Both MafA and DN-MafA were induced in an all-or-none manner. Immunofluorescence staining with antibody against HA-tag showed that both MafA (a) and DN-MafA (b) proteins were induced by doxycycline in an all-or-none manner. The phase contrast images were shown in the right panel. MafA*22 (a) and DN-MafA*39 (b) cells were cultured with (+Dox) or without (-Dox) 500 ng/ml doxycycline for 24 h.
Fig 1
Fig 1
Both MafA and DN-MafA were induced in an all-or-none manner. Immunofluorescence staining with antibody against HA-tag showed that both MafA (a) and DN-MafA (b) proteins were induced by doxycycline in an all-or-none manner. The phase contrast images were shown in the right panel. MafA*22 (a) and DN-MafA*39 (b) cells were cultured with (+Dox) or without (-Dox) 500 ng/ml doxycycline for 24 h.
Fig 2
Fig 2
MafA binding to the insulin promoter was enhanced by overexpression of MafA and diminished by induction of DN-MafA. a Immunoblotting with antibody against MafA demonstrated the graded overexpression of MafA protein after induction with incremental doses of doxycycline (left). DN-MafA protein was induced by doxycycline in an all-or-none manner (right). Nuclear proteins were extracted, respectively, from MafA*22 and DN-MafA*39 cells induced for 24 h with indicated concentrations of doxycycline. b EMSA with the RIPE3b/C1 element of the insulin promoter demonstrated that the MafA DNA binding activity was incrementally increased by graded overexpression of MafA (left) and nearly abolished by induction of DN-MafA (right). The antibody against the C-terminus of MafA supershifted both MafA and DN-MafA as expected. Nuclear proteins were extracted, respectively, from MafA*22 and DN-MafA*39 cells induced for 24 h with indicated concentrations of doxycycline. Two to four independent experiments were performed with similar results.
Fig 2
Fig 2
MafA binding to the insulin promoter was enhanced by overexpression of MafA and diminished by induction of DN-MafA. a Immunoblotting with antibody against MafA demonstrated the graded overexpression of MafA protein after induction with incremental doses of doxycycline (left). DN-MafA protein was induced by doxycycline in an all-or-none manner (right). Nuclear proteins were extracted, respectively, from MafA*22 and DN-MafA*39 cells induced for 24 h with indicated concentrations of doxycycline. b EMSA with the RIPE3b/C1 element of the insulin promoter demonstrated that the MafA DNA binding activity was incrementally increased by graded overexpression of MafA (left) and nearly abolished by induction of DN-MafA (right). The antibody against the C-terminus of MafA supershifted both MafA and DN-MafA as expected. Nuclear proteins were extracted, respectively, from MafA*22 and DN-MafA*39 cells induced for 24 h with indicated concentrations of doxycycline. Two to four independent experiments were performed with similar results.
Fig 3
Fig 3
MafA targets β-cell-specific genes. The gene expression pattern in these cells was quantitatively evaluated by Northern blotting. 20 μg total RNA samples were analysed by hybridising with indicated cDNA probes. The experiments were repeated twice with similar results. a MafA*22 cells were cultured in standard medium (11.2 mM glucose) with 0, 75, 150 or 500 ng/ml doxycycline for 24 hours. Two independent experiments were blotted side by side to demonstrate the reproducibility. At 75, 150, and 500 ng/ml doxycycline concentrations, MafA was induced, respectively, by 3.2-, 8.7-, and 11.6-fold. This caused correspondingly increased expression of insulin (by 1.8-, 1.8-, and 1.5-fold), GLP-1R (by 2.4-, 2.2-, and 2.3-fold), Pdx-1 (3.1-, 4.7-, and 4.8-fold), and Nkx6.1 (2.7-, 3.1- and 4.2-fold). Data represent average of two experiments. b MafA*22 cells were cultured with or without 75 ng/ml doxycycline in 2.5 mM glucose medium for 16 h, and then incubated for further 8 h at indicated glucose concentrations. The 3.4-fold induction of MafA resulted in increased expression of insulin (by 1.9-fold), GLP-1R (by 3.2-fold), Pdx-1 (by 4.1-fold), and Nkx6.1 (by 2.3-fold). Data represent the average of experiments at four glucose concentrations. c DN-MafA*39 cells were cultured with or without 500 ng/ml doxycycline in 2.5 mM glucose medium for 16 h, and then incubated for further 8 h at indicated glucose concentrations. Induction of DN-MafA led to decreased mRNA levels of insulin (by 62%), GLP-1R (by 74%), Pxd-1 (by 91%), Nkx6.1 (by 31%), and PC1/3 (by 52%). Data represent the average at the four glucose concentrations.
Fig 3
Fig 3
MafA targets β-cell-specific genes. The gene expression pattern in these cells was quantitatively evaluated by Northern blotting. 20 μg total RNA samples were analysed by hybridising with indicated cDNA probes. The experiments were repeated twice with similar results. a MafA*22 cells were cultured in standard medium (11.2 mM glucose) with 0, 75, 150 or 500 ng/ml doxycycline for 24 hours. Two independent experiments were blotted side by side to demonstrate the reproducibility. At 75, 150, and 500 ng/ml doxycycline concentrations, MafA was induced, respectively, by 3.2-, 8.7-, and 11.6-fold. This caused correspondingly increased expression of insulin (by 1.8-, 1.8-, and 1.5-fold), GLP-1R (by 2.4-, 2.2-, and 2.3-fold), Pdx-1 (3.1-, 4.7-, and 4.8-fold), and Nkx6.1 (2.7-, 3.1- and 4.2-fold). Data represent average of two experiments. b MafA*22 cells were cultured with or without 75 ng/ml doxycycline in 2.5 mM glucose medium for 16 h, and then incubated for further 8 h at indicated glucose concentrations. The 3.4-fold induction of MafA resulted in increased expression of insulin (by 1.9-fold), GLP-1R (by 3.2-fold), Pdx-1 (by 4.1-fold), and Nkx6.1 (by 2.3-fold). Data represent the average of experiments at four glucose concentrations. c DN-MafA*39 cells were cultured with or without 500 ng/ml doxycycline in 2.5 mM glucose medium for 16 h, and then incubated for further 8 h at indicated glucose concentrations. Induction of DN-MafA led to decreased mRNA levels of insulin (by 62%), GLP-1R (by 74%), Pxd-1 (by 91%), Nkx6.1 (by 31%), and PC1/3 (by 52%). Data represent the average at the four glucose concentrations.
Fig 4
Fig 4
MafA targets genes essential for metabolism-secretion coupling. Total RNA samples (20 μg) were analysed by hybridising with indicated cDNA probes. The experiments were repeated twice with similar results. a MafA*22 cells were cultured as described in Fig. 3a. Two seperate experiments were blotted side by side to demonstrate the consistency. MafA was induced, respectively, by 3.4-, 8.3-, and 10.2-fold by 75, 150, and 500 ng/ml doxycycline. This resulted in corresponding increases in the mRNA levels of pyruvate carboxylase (by 4.4-, 4.8-, and 4.5-fold), Glut2 (by 3.1-, 3.7-, and 3.3-fold), and glucokinase (by 2.2-, 2.1-, and 1.8-fold). Data represent the average of two experiments. b MafA*22 cells were cultured as described in Fig. 3b. 3.6-fold induction of MafA caused increased expression of pyruvate carboxylase, Glut2, and glucokinase, respectively, by 4.3-, 2.4-, and 1.9-fold. Data represent the average at four glucose concentrations. c DN-MafA*39 cells were cultured as described in Fig. 3c. The gene expression pattern in these cells was quantitatively evaluated by Northcern blotting. The equilibration with 2.5 mM glucose is necessary to observe the glucose-responsive gene expression, such as Glut2. Induction of DN-MafA led to decreased expression of pyruvate carboxylase, Glut2, and glucokinase, respectively, by 62%, 46%, and 37%. Data represent the average at four glucose concentrations.
Fig 4
Fig 4
MafA targets genes essential for metabolism-secretion coupling. Total RNA samples (20 μg) were analysed by hybridising with indicated cDNA probes. The experiments were repeated twice with similar results. a MafA*22 cells were cultured as described in Fig. 3a. Two seperate experiments were blotted side by side to demonstrate the consistency. MafA was induced, respectively, by 3.4-, 8.3-, and 10.2-fold by 75, 150, and 500 ng/ml doxycycline. This resulted in corresponding increases in the mRNA levels of pyruvate carboxylase (by 4.4-, 4.8-, and 4.5-fold), Glut2 (by 3.1-, 3.7-, and 3.3-fold), and glucokinase (by 2.2-, 2.1-, and 1.8-fold). Data represent the average of two experiments. b MafA*22 cells were cultured as described in Fig. 3b. 3.6-fold induction of MafA caused increased expression of pyruvate carboxylase, Glut2, and glucokinase, respectively, by 4.3-, 2.4-, and 1.9-fold. Data represent the average at four glucose concentrations. c DN-MafA*39 cells were cultured as described in Fig. 3c. The gene expression pattern in these cells was quantitatively evaluated by Northcern blotting. The equilibration with 2.5 mM glucose is necessary to observe the glucose-responsive gene expression, such as Glut2. Induction of DN-MafA led to decreased expression of pyruvate carboxylase, Glut2, and glucokinase, respectively, by 62%, 46%, and 37%. Data represent the average at four glucose concentrations.
Fig 5
Fig 5
MafA regulates nutrient-stimulated insulin secretion. a MafA*22 cells were cultured in standard medium (11.2 mM glucose) with (+Dox) or without 75 ng/ml doxycycline (-Dox) for 19 h, and then equilibrated in 2.5 mmol/l glucose medium for a further 5 h. Insulin-release from MafA*22 cells in KRBH buffer containing indicated concentrations of glucose was determined by radio-immunoassay and expressed as percentage of cellular insulin content. Cellular insulin content was increased by 23% (-Dox: 2.16 ± 0.23 μg/mg protein; +Dox: 2.65 ± 0.25 μg/mg protein, n=6, p<0.01) after MafA induction. b DN-MafA*39 cells were cultured in standard medium (11.2 mM glucose) with (+Dox) or without 500 ng/ml doxycycline (-Dox) for 19 h, and then equilibrated in 2.5 mmol/l glucose medium for a further 5 h. Induction of DN-MafA resulted in defective insulin-release induced by (mM:) 24 glucose, 5 pyruvate, and 20 KCl. Insulin secretion from DN-MafA*39 cells stimulated by (mM:) 24 glucose, 5 pyruvate, and 20 KCl was measured in KRBH containing 2.5 mmol/l glucose (Basal) was expressed as percentage of cellular insulin content. Cellular insulin content was reduced by 27% (-Dox: 2.245 ± 0.22; +Dox: 1.64 ± 0.20 μg/mg protein, n=6, p<0.005). Data represent mean ± SEM of six independent experiments. *p<0.05, **p<0.001.
Fig 5
Fig 5
MafA regulates nutrient-stimulated insulin secretion. a MafA*22 cells were cultured in standard medium (11.2 mM glucose) with (+Dox) or without 75 ng/ml doxycycline (-Dox) for 19 h, and then equilibrated in 2.5 mmol/l glucose medium for a further 5 h. Insulin-release from MafA*22 cells in KRBH buffer containing indicated concentrations of glucose was determined by radio-immunoassay and expressed as percentage of cellular insulin content. Cellular insulin content was increased by 23% (-Dox: 2.16 ± 0.23 μg/mg protein; +Dox: 2.65 ± 0.25 μg/mg protein, n=6, p<0.01) after MafA induction. b DN-MafA*39 cells were cultured in standard medium (11.2 mM glucose) with (+Dox) or without 500 ng/ml doxycycline (-Dox) for 19 h, and then equilibrated in 2.5 mmol/l glucose medium for a further 5 h. Induction of DN-MafA resulted in defective insulin-release induced by (mM:) 24 glucose, 5 pyruvate, and 20 KCl. Insulin secretion from DN-MafA*39 cells stimulated by (mM:) 24 glucose, 5 pyruvate, and 20 KCl was measured in KRBH containing 2.5 mmol/l glucose (Basal) was expressed as percentage of cellular insulin content. Cellular insulin content was reduced by 27% (-Dox: 2.245 ± 0.22; +Dox: 1.64 ± 0.20 μg/mg protein, n=6, p<0.005). Data represent mean ± SEM of six independent experiments. *p<0.05, **p<0.001.
Fig 6
Fig 6
MafA is expressed specifically in β-cells of human islets. a Immunofluorescent detection of the islet transcription factors Isl-1, IPF-1 or mafA (green), insulin (red) as well as DAPI nuclei staining (blue) in dispersed human islet cells cultured at 11.2 mM glucose for 24 h. Similar to IPF-1, MafA is exclusively detected in the nuclei of insulin positive cells. b Immunocytochemical detection of mafA (green) and β-cells (insulin in red) was performed 24 hr after incubation with the indicated concentrations of glucose with or without the presence of the GLP-1R agonist exendin-4 (Ex-4, 10 nM). The merge image of the MafA and insulin expressing β-cells is shown.
Fig 6
Fig 6
MafA is expressed specifically in β-cells of human islets. a Immunofluorescent detection of the islet transcription factors Isl-1, IPF-1 or mafA (green), insulin (red) as well as DAPI nuclei staining (blue) in dispersed human islet cells cultured at 11.2 mM glucose for 24 h. Similar to IPF-1, MafA is exclusively detected in the nuclei of insulin positive cells. b Immunocytochemical detection of mafA (green) and β-cells (insulin in red) was performed 24 hr after incubation with the indicated concentrations of glucose with or without the presence of the GLP-1R agonist exendin-4 (Ex-4, 10 nM). The merge image of the MafA and insulin expressing β-cells is shown.
Fig 7
Fig 7
Bell-shaped DNA-binding of MafA in response to glucose in demonstrated in rat islets. EMSA was performed using with the RIPE3b/C1 element of the insulin promoter. Nuclear proteins were extracted from rat islets cultured with 2.5, 5, 15, and 30 mM glucose for 48 h. DNA-binding activity was increased, respectively, by 3.3 ± 0.7, 12.1 ± 2.5, and 2.2 ± 0.4 fold (n=3), at 5, 15, and 30 mM glucose concentrations. Data were calculated by scanning three independent EMSA experiments using rat islets from two separate isolations.

Similar articles

Cited by

References

    1. Sharma A, Stein R. Glucose-induced transcription of the insulin gene is mediated by factors required for beta-cell-type-specific expression. Mol Cell Biol. 1994;14:871–879. - PMC - PubMed
    1. Onheda K, Mirmira RG, Wang J, Johnson JD, German MS. The homeodomain of PDX-1 mediates multiple protein-protein interactions in the formation of a transcriptional activation complex on the insulin promoter. Mol.Cell.Biol. 2000;20:900–911. - PMC - PubMed
    1. Olbrot M, Rud J, Moss LG, Sharma A. Identification of beta-cell-specific insulin gene transcription factor RIPE3b1 as mammalian MafA. Proc Natl Acad Sci U S A. 2002;99:6737–6742. - PMC - PubMed
    1. Naya FJ, Stellrecht CM, Tsai MJ. Tissue-specific regulation of the insulin gene by a novel basic helix-loop-helix transcription factor. Genes Dev. 1995;9:1009–1019. - PubMed
    1. Marshak S, totary H, Cerasi E, Melloul D. Putification of the beta-cell glucose-sensitive factor that transactivates the insulin gene differentially in normal and transformed islet cells. Proc.Natl.Acad.Sci.USA. 1996;93:15057–15062. - PMC - PubMed

Publication types

MeSH terms