

Molecular alterations in the cerebellum of the plasma membrane calcium ATPase 2 (PMCA2)-null mouse indicate abnormalities in Purkinje neurons
- PMID: 17150372
- PMCID: PMC2561181
- DOI: 10.1016/j.mcn.2006.10.010
Molecular alterations in the cerebellum of the plasma membrane calcium ATPase 2 (PMCA2)-null mouse indicate abnormalities in Purkinje neurons
Abstract
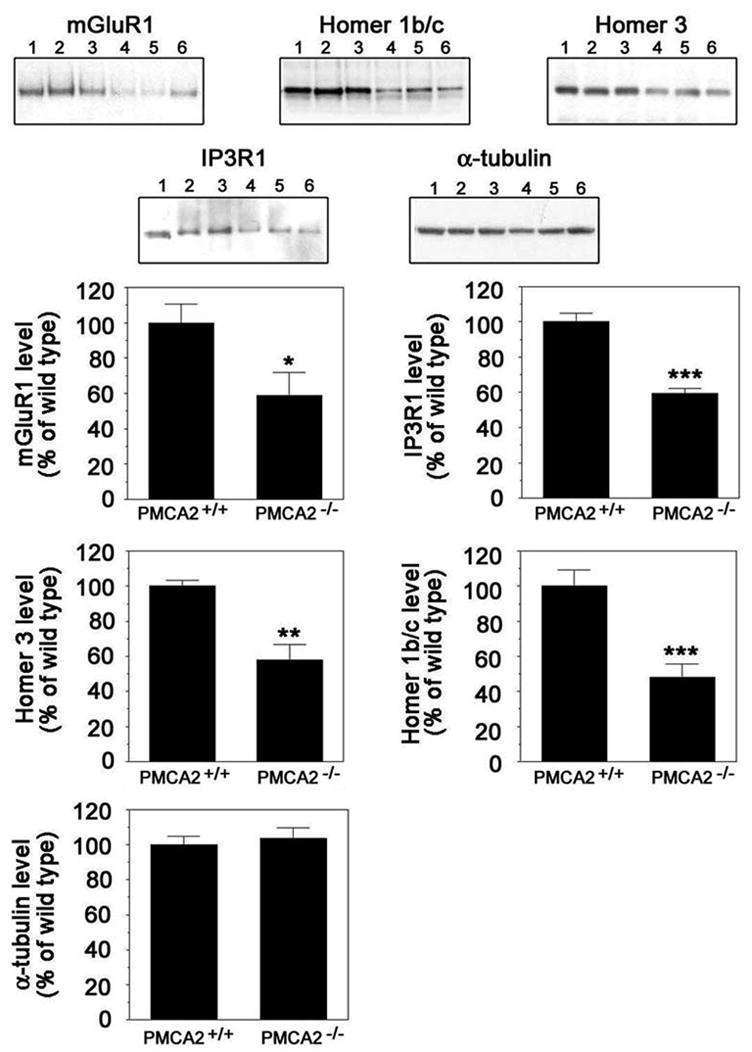
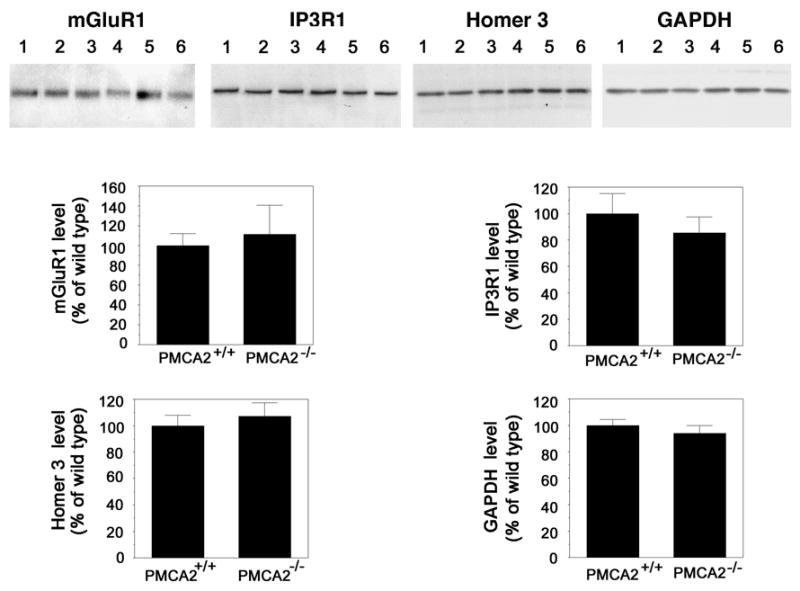
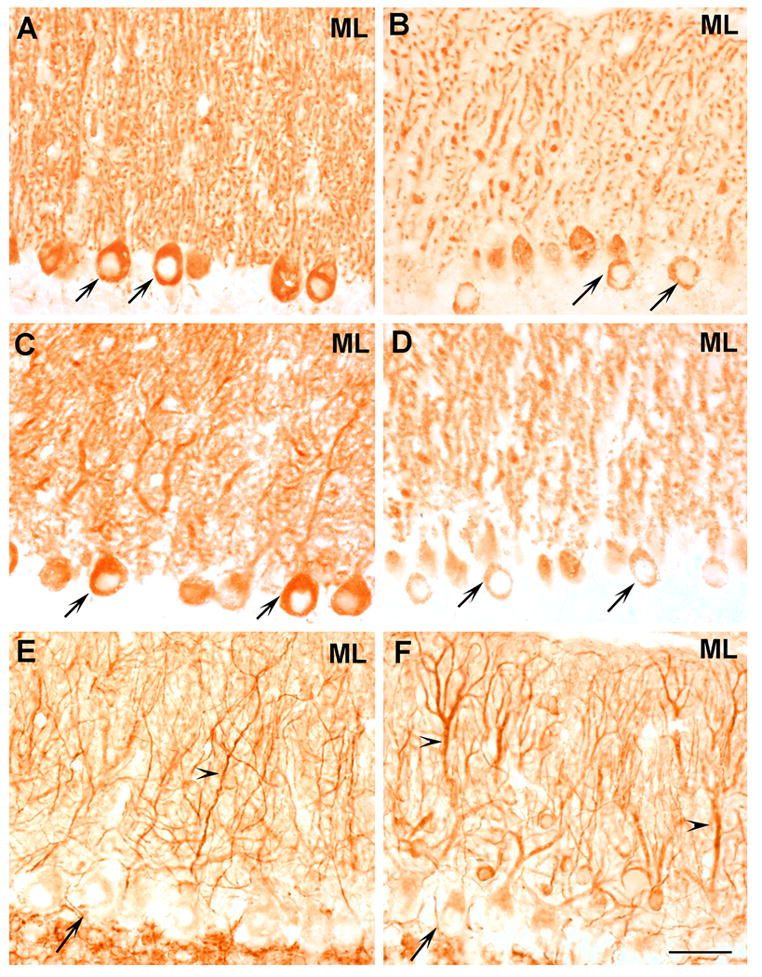
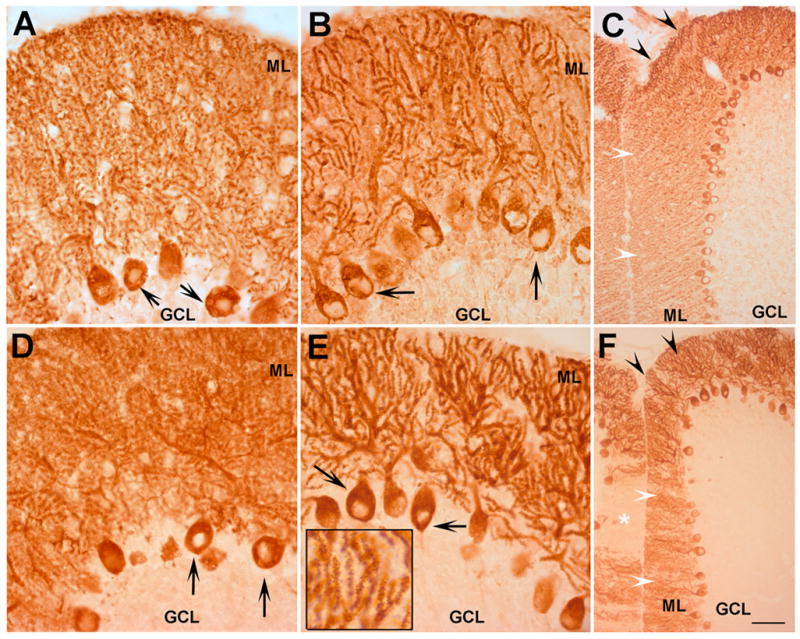
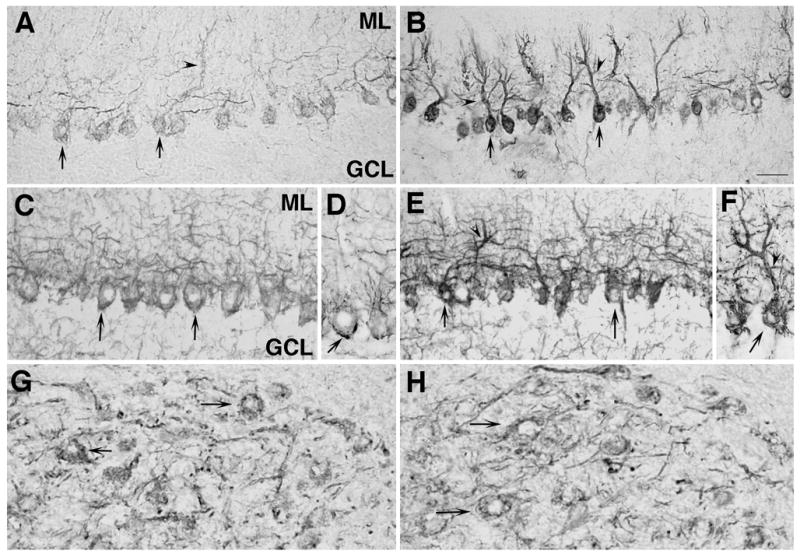
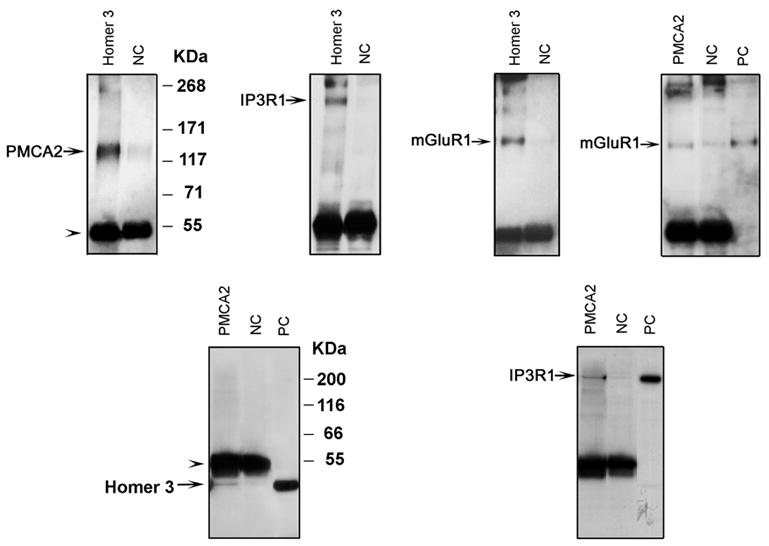
PMCA2, a major calcium pump, is expressed at particularly high levels in Purkinje neurons. Accordingly, PMCA2-null mice exhibit ataxia suggesting cerebellar pathology. It is not yet known how changes in PMCA2 expression or activity affect molecular pathways in Purkinje neurons. We now report that the levels of metabotropic glutamate receptor 1 (mGluR1), which plays essential roles in motor coordination, synaptic plasticity, and associative learning, are reduced in the cerebellum of PMCA2-null mice as compared to wild type littermates. The levels of inositol 1,4,5-triphosphate receptor type 1 (IP3R1), an effector downstream to mGluR1, which mediates intracellular calcium signaling, and the expression of Homer 1b/c and Homer 3, scaffold proteins that couple mGluR1 to IP3R1, are also reduced in somata and dendrites of some Purkinje cell subpopulations. In contrast, no alterations occur in the levels of mGluR1 and its downstream effectors in the hippocampus, indicating that the changes are region specific. The reduction in cerebellar mGluR1, IP3R1 and Homer 3 levels are neither due to a generic decrease in Purkinje proteins nor extensive dendritic loss as immunoreactivity to total and non-phosphorylated neurofilament H (NFH) is increased in Purkinje dendrites and microtubule associated protein 2 (MAP2) staining reveals a dense dendritic network in the molecular layer of the PMCA2-null mouse cerebellum. PMCA2 coimmunoprecipitates with mGluR1, Homer 3 and IP3R1, suggesting that the calcium pump is a constituent of the mGluR1 signaling complex. Our results suggest that the decrease in the expression of mGluR1 and its downstream effectors and perturbations in the mGluR1 signaling complex in the absence of PMCA2 may cumulatively result in aberrant metabotropic glutamate receptor signaling in Purkinje neurons leading to cerebellar deficits in the PMCA2-null mouse.
Figures
Similar articles
-
Purkinje cell dysfunction and delayed death in plasma membrane calcium ATPase 2-heterozygous mice.Mol Cell Neurosci. 2012 Aug;51(1-2):22-31. doi: 10.1016/j.mcn.2012.07.001. Epub 2012 Jul 10. Mol Cell Neurosci. 2012. PMID: 22789621 Free PMC article.
-
Signaling complex formation of phospholipase Cbeta4 with metabotropic glutamate receptor type 1alpha and 1,4,5-trisphosphate receptor at the perisynapse and endoplasmic reticulum in the mouse brain.Eur J Neurosci. 2004 Dec;20(11):2929-44. doi: 10.1111/j.1460-9568.2004.03768.x. Eur J Neurosci. 2004. PMID: 15579147
-
Survival strategies for mouse cerebellar Purkinje neurons lacking PMCA2.Neurosci Lett. 2018 Jan 10;663:25-28. doi: 10.1016/j.neulet.2017.09.045. Neurosci Lett. 2018. PMID: 29452612 Review.
-
The plasma membrane Ca2+-ATPase2 (PMCA2) is involved in the regulation of Purkinje cell dendritic growth in cerebellar organotypic slice cultures.Neural Plast. 2013;2013:321685. doi: 10.1155/2013/321685. Epub 2013 Sep 29. Neural Plast. 2013. PMID: 24288624 Free PMC article.
-
mGluR1 signaling in cerebellar Purkinje cells: Subcellular organization and involvement in cerebellar function and disease.Neuropharmacology. 2021 Aug 15;194:108629. doi: 10.1016/j.neuropharm.2021.108629. Epub 2021 Jun 4. Neuropharmacology. 2021. PMID: 34089728 Review.
Cited by
-
Reduced expression of plasma membrane calcium ATPase 2 and collapsin response mediator protein 1 promotes death of spinal cord neurons.Cell Death Differ. 2010 Sep;17(9):1501-10. doi: 10.1038/cdd.2010.54. Epub 2010 May 21. Cell Death Differ. 2010. PMID: 20489728 Free PMC article.
-
Plasma membrane calcium ATPases as novel candidates for therapeutic agent development.J Pharm Pharm Sci. 2013;16(2):190-206. doi: 10.18433/j3z011. J Pharm Pharm Sci. 2013. PMID: 23958189 Free PMC article. Review.
-
β-Estradiol unmasks metabotropic receptor-mediated metaplasticity of NMDA receptor transmission in the female rat dentate gyrus.Psychoneuroendocrinology. 2012 Nov;37(11):1845-54. doi: 10.1016/j.psyneuen.2012.03.023. Epub 2012 Apr 27. Psychoneuroendocrinology. 2012. PMID: 22541715 Free PMC article.
-
A new Atp2b2 deafwaddler allele, dfw(i5), interacts strongly with Cdh23 and other auditory modifiers.Hear Res. 2013 Oct;304:41-8. doi: 10.1016/j.heares.2013.06.003. Epub 2013 Jun 18. Hear Res. 2013. PMID: 23792079 Free PMC article.
-
Purkinje cell dysfunction and delayed death in plasma membrane calcium ATPase 2-heterozygous mice.Mol Cell Neurosci. 2012 Aug;51(1-2):22-31. doi: 10.1016/j.mcn.2012.07.001. Epub 2012 Jul 10. Mol Cell Neurosci. 2012. PMID: 22789621 Free PMC article.
References
-
- Aiba A, Kano M, Chen C, Stanton ME, Fox GD, Herrup K, Zwingman TA, Tonegawa S. Deficient cerebellar long-term depression and impaired motor learning in mGluR1 mutant mice. Cell. 1994;79:377–88. - PubMed
-
- Brakeman PR, Lanahan AA, O'Brien R, Roche K, Barnes CA, Huganir RL, Worley PF. Homer: a protein that selectively binds metabotropic glutamate receptors. Nature. 1997;386:284–8. - PubMed
-
- Burette A, Rockwood JM, Strehler EE, Weinberg RJ. Isoform-specific distribution of the plasma membrane Ca2+ ATPase in the rat brain. J Comp Neurol. 2003;467:464–76. - PubMed
-
- Conquet F, Bashir ZI, Davies CH, Daniel H, Ferraguti F, Bordi F, Franz-Bacon K, Reggiani A, Materese V, Conde F, Collingridge GL, Crepel F. Motor deficit and impairment of synaptic plasticity in mice lacking mGluR1. Nature. 1994;372:237–43. - PubMed
Publication types
MeSH terms
Substances
Grants and funding
LinkOut - more resources
Full Text Sources
Molecular Biology Databases
