. 2007 Mar;81(5):2401-17.
doi: 10.1128/JVI.02024-06. Epub 2006 Dec 6.

Intracellular Tat of human immunodeficiency virus type 1 activates lytic cycle replication of Kaposi's sarcoma-associated herpesvirus: role of JAK/STAT signaling

Affiliations

Intracellular Tat of human immunodeficiency virus type 1 activates lytic cycle replication of Kaposi's sarcoma-associated herpesvirus: role of JAK/STAT signaling

Yi Zeng et al. J Virol. 2007 Mar.

Abstract

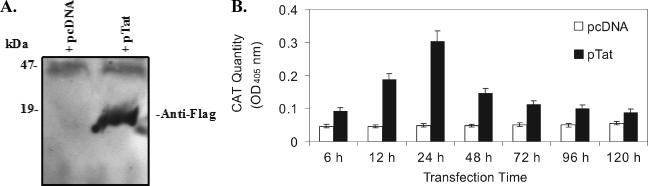
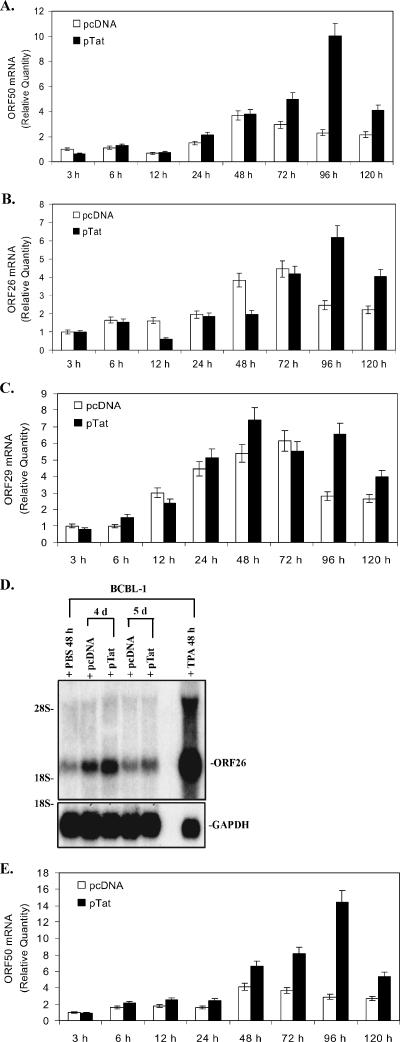
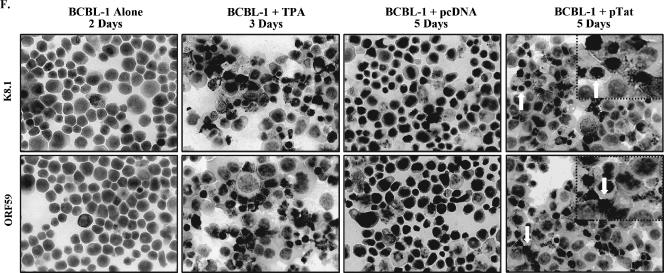
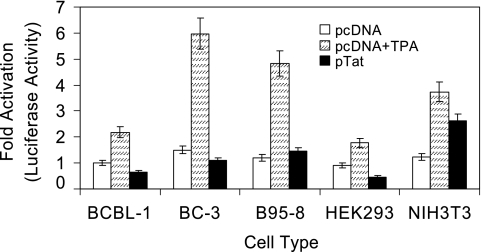
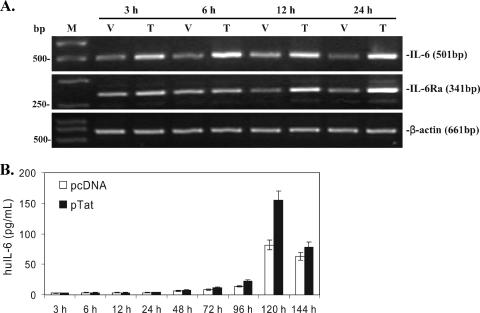
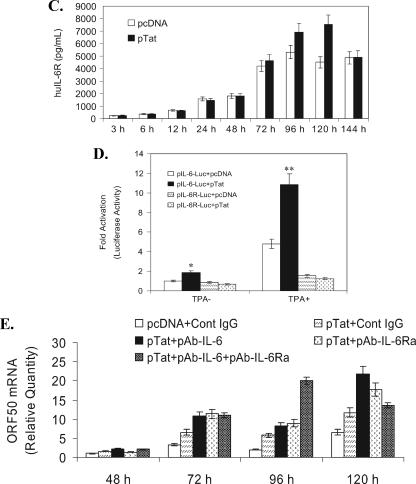
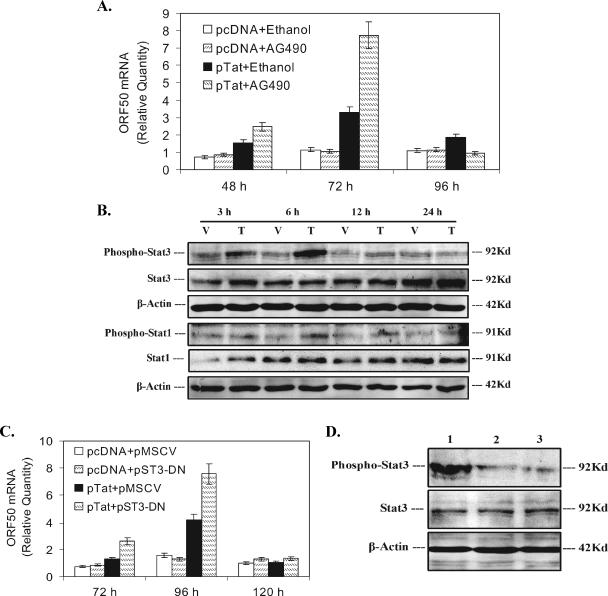
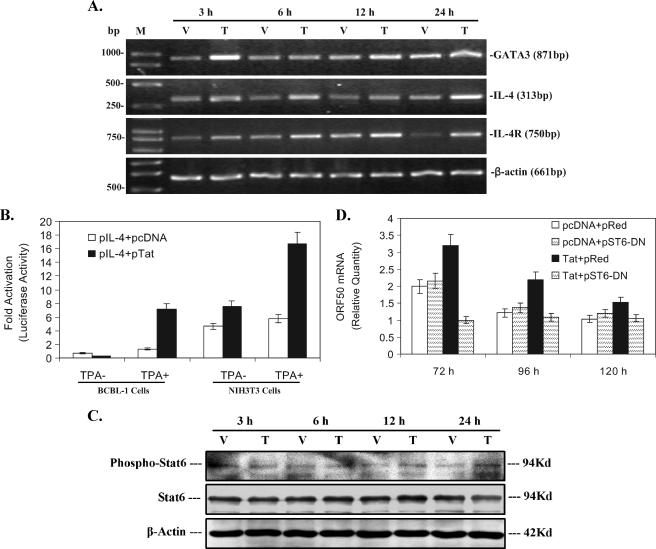
Human immunodeficiency virus type 1 (HIV-1) infection significantly increases the risk of Kaposi's sarcoma (KS) occurrence in individuals infected with Kaposi's sarcoma-associated herpesvirus (KSHV). KSHV infection appears to be necessary but not sufficient for KS development without other cofactors. However, factors that facilitate KSHV to cause KS have not been well defined. Previously, we determined that human herpesvirus 6 was one of the cofactors that activated lytic cycle replication of KSHV. Here, we demonstrate that the Tat protein of HIV-1 is a potentially important factor in the pathogenesis of KS, as determined by production of lytic phase mRNA transcripts and viral proteins in BCBL-1 cells. Mechanistic studies showed ectopic expression of Tat induced the production of human interleukin-6 (huIL-6) and its receptor (huIL-6Ra) and activated STAT3 signaling. Neutralization of huIL-6 or huIL-6R or inhibition of STAT3 signaling enhanced the replication. In addition, IL-4/STAT6 signaling also partially contributed to Tat-induced KSHV replication. These findings suggest that Tat may participate in KS pathogenesis by inducing KSHV replication and increasing KSHV viral load. These data also suggest that JAK/STAT signaling may be of therapeutic value in AIDS-related KS patients.


Figures

FIG. 1.
FIG. 1.
Expression of HIV-1 Tat and its functional activity in BCBL-1 cells. (A) Tat protein expressed in BCBL-1 cells following transfection with the plasmid pTat. Whole-cell extracts of protein isolated from BCBL-1 cells transfected with the plasmids pcDNA (negative control; + pcDNA) or pTat (+pTat) for 48 h were transferred to an Immobilon P (polyvinylidene difluoride) membrane, and expression of Tat protein was detected by Western blotting with anti-Flag antibody. (B) ELISA for CAT in BCBL-1 cells cotransfected with pTat and pTZIII-CAT. CAT protein expression in BCBL-1 cells cotransfected with pcDNA and pTZIII-CAT (pcDNA) or pTat and pTZIII-CAT (pTat) for 6 to 120 h was quantitated by ELISA. Results presented were from three independent experiments performed in triplicate.
FIG. 2.
FIG. 2.
Expression of KSHV lytic cycle RNA and protein in PEL cell lines transfected with Tat. (A) ORF50 mRNA expressed in BCBL-1 cells following transfection with pTat. ORF50 mRNA expression in BCBL-1 cells transfected with pcDNA or pTat for 3, 6, 12, 24, 48, 72, 96, and 120 h was quantitated by real-time quantitative PCR. Relative quantities of ORF50 expression are represented on the y axis. Results shown were from five independent experiments performed in triplicate. (B) ORF26 mRNA expressed in BCBL-1 cells following transfection with pTat. ORF26 mRNA expression in BCBL-1 cells transfected with pcDNA or pTat for 3, 6, 12, 24, 48, 72, 96, and 120 h was quantitated by real-time quantitative PCR. Relative quantities of ORF26 expression are represented on the y axis. Results shown are from five independent experiments performed in triplicate. (C) ORF29 mRNA expressed in BCBL-1 cells following transfection with pTat. ORF29 mRNA expression in BCBL-1 cells transfected with pcDNA or pTat for 3, 6, 12, 24, 48, 72, 96, and 120 h was quantitated by real-time quantitative PCR. Relative quantities of ORF29 expression are represented on the y axis. Results shown are from five independent experiments performed in triplicate. (D) Northern blot analysis for ORF26 mRNA expressed in BCBL-1 cells following transfection with pTat. Total RNA isolated from BCBL-1 cells treated with PBS (negative control) and TPA (positive control) for 48 h, from BCBL-1 cells transfected with pcDNA for 4 and 5 days (pcDNA 4 d and 5 d, respectively), and from BCBL-1 cells transfected with pTat for 4 and 5 days (pTat 4 d and 5 d, respectively) were transferred to a nylon membrane, and ORF26 mRNA expression was detected by Northern blotting. The same membrane was stripped and reprobed for glyceraldehyde-3-phosphate dehydrogenase (GAPDH) to demonstrate equal loading of the RNA. Results shown are a representative experiment of at least two independent experiments with similar results. (E) ORF50 mRNA expressed in BC-3 cells following transfection with pTat. ORF50 mRNA in BC-3 cells transfected with pcDNA or pTat for 3, 6, 12, 24, 48, 72, 96, and 120 h was quantitated by real-time quantitative PCR. Relative quantities of ORF50 expression are represented on the y axis. Results shown are from five independent experiments performed in triplicate. (F) Immunohistochemical staining of BCBL-1 cells transfected with pTat (original magnification, × 60). Expression levels of KSHV lytic proteins ORF K8.1 (top panel) and ORF59 (bottom panel) in BCBL-1 cells (negative control; BCBL-1 alone), TPA-treated BCBL-1 cells (positive control; BCBL-1 + TPA), BCBL-1 cells transfected with pcDNA (BCBL-1 + pcDNA), and BCBL-1 cells transfected with pTat (BCBL-1 + pTat) were detected by immunohistochemistry with ORF K8.1 and ORF59 monoclonal antibodies. The lighter-shaded reaction product signifies positive detection of the specified antigen. Arrows highlight examples of positive cells.
FIG. 2.
FIG. 2.
Expression of KSHV lytic cycle RNA and protein in PEL cell lines transfected with Tat. (A) ORF50 mRNA expressed in BCBL-1 cells following transfection with pTat. ORF50 mRNA expression in BCBL-1 cells transfected with pcDNA or pTat for 3, 6, 12, 24, 48, 72, 96, and 120 h was quantitated by real-time quantitative PCR. Relative quantities of ORF50 expression are represented on the y axis. Results shown were from five independent experiments performed in triplicate. (B) ORF26 mRNA expressed in BCBL-1 cells following transfection with pTat. ORF26 mRNA expression in BCBL-1 cells transfected with pcDNA or pTat for 3, 6, 12, 24, 48, 72, 96, and 120 h was quantitated by real-time quantitative PCR. Relative quantities of ORF26 expression are represented on the y axis. Results shown are from five independent experiments performed in triplicate. (C) ORF29 mRNA expressed in BCBL-1 cells following transfection with pTat. ORF29 mRNA expression in BCBL-1 cells transfected with pcDNA or pTat for 3, 6, 12, 24, 48, 72, 96, and 120 h was quantitated by real-time quantitative PCR. Relative quantities of ORF29 expression are represented on the y axis. Results shown are from five independent experiments performed in triplicate. (D) Northern blot analysis for ORF26 mRNA expressed in BCBL-1 cells following transfection with pTat. Total RNA isolated from BCBL-1 cells treated with PBS (negative control) and TPA (positive control) for 48 h, from BCBL-1 cells transfected with pcDNA for 4 and 5 days (pcDNA 4 d and 5 d, respectively), and from BCBL-1 cells transfected with pTat for 4 and 5 days (pTat 4 d and 5 d, respectively) were transferred to a nylon membrane, and ORF26 mRNA expression was detected by Northern blotting. The same membrane was stripped and reprobed for glyceraldehyde-3-phosphate dehydrogenase (GAPDH) to demonstrate equal loading of the RNA. Results shown are a representative experiment of at least two independent experiments with similar results. (E) ORF50 mRNA expressed in BC-3 cells following transfection with pTat. ORF50 mRNA in BC-3 cells transfected with pcDNA or pTat for 3, 6, 12, 24, 48, 72, 96, and 120 h was quantitated by real-time quantitative PCR. Relative quantities of ORF50 expression are represented on the y axis. Results shown are from five independent experiments performed in triplicate. (F) Immunohistochemical staining of BCBL-1 cells transfected with pTat (original magnification, × 60). Expression levels of KSHV lytic proteins ORF K8.1 (top panel) and ORF59 (bottom panel) in BCBL-1 cells (negative control; BCBL-1 alone), TPA-treated BCBL-1 cells (positive control; BCBL-1 + TPA), BCBL-1 cells transfected with pcDNA (BCBL-1 + pcDNA), and BCBL-1 cells transfected with pTat (BCBL-1 + pTat) were detected by immunohistochemistry with ORF K8.1 and ORF59 monoclonal antibodies. The lighter-shaded reaction product signifies positive detection of the specified antigen. Arrows highlight examples of positive cells.
FIG. 3.
FIG. 3.
Transfection of PEL cell lines with Tat does not promote induction of KSHV ORF50 promoter activity. BCBL-1, BC-3, B95-8, HEK293, and NIH 3T3 cells were cotransfected with p50-Luc and pcDNA (negative control, pcDNA), p50-Luc and pcDNA following treatment with TPA (positive control, pcDNA + TPA), or p50-Luc and pTat (pTat). Luciferase activities were measured as induction. All data points were the averages of four independent experiments performed in triplicate.
FIG. 4.
FIG. 4.
Inhibition of huIL-6 and huIL-6Ra expression increases Tat-induced KSHV replication. (A) RT-PCR analysis of huIL-6 and IL-6Ra mRNA expression in Tat-transfected BCBL-1 cells. HuIL-6 and huIL-6Ra mRNA expression in BCBL-1 cells transfected with pcDNA vector (V) or pTat (T) for 3, 6, 12, and 24 h was detected by RT-PCR. M, DNA molecular marker. β-Actin was used as an internal control to monitor the presence of amplifiable cDNA in all samples. (B) Expression of huIL-6 in BCBL-1 cells transfected for 3 to 144 h with pTat. Supernatants from BCBL-1 cells transfected with pcDNA or pTat for various times were collected for detection of huIL-6 by ELISA. Results are from three independent experiments with duplicates. (C) Expression of huIL-6Ra in BCBL-1 cells transfected for 3 to 144 h with pTat. Supernatants from BCBL-1 cells transfected with pcDNA or pTat for various times were collected for detection of huIL-6Ra by ELISA. Results are from three independent experiments with duplicates. (D) Effects of Tat on huIL-6 and huIL-6Ra promoter activities in BCBL-1 cells. BCBL-1 cells were cotransfected with pIL-6-Luc and pcDNA, pIL-6-Luc and pTat, pIL-6R-Luc and pcDNA, and pIL-6R-Luc and pTat following treatment without TPA or with TPA. Luciferase activities were measured as induction. All data points were the averages of four independent experiments performed in triplicate. * and ** indicate statistically significant increases in luciferase expression in the absence and presence of TPA compared to the corresponding control. (E) Real-time quantitative PCR analysis for ORF50 mRNA expression in a blocking assay with PAb against huIL-6. Real-time quantitative PCR was used to detect relative quantities of ORF50 mRNA in pcDNA-transfected BCBL-1 cells plus control IgG (pcDNA + Cont IgG), pTat-transfected BCBL-1 cells plus control IgG (pTat + Cont IgG), pTat-transfected BCBL-1 cells plus 25 μg/ml of PAb against huIL-6 (pTat + pAb-IL-6), pTat-transfected BCBL-1 cells plus 25 μg/ml of PAb against huIL-6Ra (pTat + pAb-IL-6Ra), and pTat-transfected BCBL-1 cells plus PAbs against huIL-6 and huIL-6Ra in combination (pTat + pAb-IL-6 + pAb-IL-6Ra) for 48, 72, 96, and 120 h. The results from three independent experiments performed in triplicate are shown.
FIG. 4.
FIG. 4.
Inhibition of huIL-6 and huIL-6Ra expression increases Tat-induced KSHV replication. (A) RT-PCR analysis of huIL-6 and IL-6Ra mRNA expression in Tat-transfected BCBL-1 cells. HuIL-6 and huIL-6Ra mRNA expression in BCBL-1 cells transfected with pcDNA vector (V) or pTat (T) for 3, 6, 12, and 24 h was detected by RT-PCR. M, DNA molecular marker. β-Actin was used as an internal control to monitor the presence of amplifiable cDNA in all samples. (B) Expression of huIL-6 in BCBL-1 cells transfected for 3 to 144 h with pTat. Supernatants from BCBL-1 cells transfected with pcDNA or pTat for various times were collected for detection of huIL-6 by ELISA. Results are from three independent experiments with duplicates. (C) Expression of huIL-6Ra in BCBL-1 cells transfected for 3 to 144 h with pTat. Supernatants from BCBL-1 cells transfected with pcDNA or pTat for various times were collected for detection of huIL-6Ra by ELISA. Results are from three independent experiments with duplicates. (D) Effects of Tat on huIL-6 and huIL-6Ra promoter activities in BCBL-1 cells. BCBL-1 cells were cotransfected with pIL-6-Luc and pcDNA, pIL-6-Luc and pTat, pIL-6R-Luc and pcDNA, and pIL-6R-Luc and pTat following treatment without TPA or with TPA. Luciferase activities were measured as induction. All data points were the averages of four independent experiments performed in triplicate. * and ** indicate statistically significant increases in luciferase expression in the absence and presence of TPA compared to the corresponding control. (E) Real-time quantitative PCR analysis for ORF50 mRNA expression in a blocking assay with PAb against huIL-6. Real-time quantitative PCR was used to detect relative quantities of ORF50 mRNA in pcDNA-transfected BCBL-1 cells plus control IgG (pcDNA + Cont IgG), pTat-transfected BCBL-1 cells plus control IgG (pTat + Cont IgG), pTat-transfected BCBL-1 cells plus 25 μg/ml of PAb against huIL-6 (pTat + pAb-IL-6), pTat-transfected BCBL-1 cells plus 25 μg/ml of PAb against huIL-6Ra (pTat + pAb-IL-6Ra), and pTat-transfected BCBL-1 cells plus PAbs against huIL-6 and huIL-6Ra in combination (pTat + pAb-IL-6 + pAb-IL-6Ra) for 48, 72, 96, and 120 h. The results from three independent experiments performed in triplicate are shown.
FIG. 5.
FIG. 5.
Inhibition of JAK2/STAT3 signaling by huIL-6 partially enhances Tat-induced KSHV replication. (A) AG490 enhances KSHV replication by Tat. Real-time quantitative PCR was used to detect relative quantities of ORF50 mRNA in pcDNA-transfected BCBL-1 cells plus ethanol, pcDNA-transfected BCBL-1 cells plus AG490, pTat-transfected BCBL-1 cells plus ethanol, and pTat-transfected BCBL-1 cells plus AG490 for 48, 72, and 96 h as indicated. The results from three independent experiments performed in triplicate are shown. (B) Activation STAT1 and -3 in Tat-transfected BCBL-1 cells. BCBL-1 cells were transfected with pcDNA vector (V) or pTat (T) for 3, 6, 12, and 24 h. Lysates were subjected to SDS-PAGE, transferred to a membrane, and then immunoblotted with the indicated anti-phospho antibody. The membrane was stripped and reprobed with the respective antibody or with antiactin to confirm equal amounts of protein in each sample. The results shown are from a representative experiment of at least three independent experiments with similar results. (C) Inhibition of STAT3 activation partially enhances KSHV replication by Tat. Real-time quantitative PCR was employed to detect relative quantities of ORF50 mRNA in BCBL-1 cells cotransfected with pcDNA and pMSCV vector, pcDNA and pST3-DN, pTat and pMSCV vector, or pTat and pST3-DN for 72, 96, and 120 h as indicated. The results from three independent experiments performed in triplicate are shown. (D) Overexpression of dominant negative STAT3 reduces phosphorylation of Tat-induced STAT3. BCBL-1 cells were cotransfected with pTat and pMSCV vector (lane 1), pTat and pST3-DN (lane 2), or pcDNA and pMSCV vector (lane 3) for 6 h. Lysates were subjected to SDS-PAGE, transferred to a membrane, and then immunoblotted with the indicated anti-phospho-STAT3 antibody. The membrane was stripped and reprobed with anti-STAT3 and antiactin antibodies to confirm equal amounts of protein in each sample. The results shown are from a representative experiment of three independent experiments with similar results.
FIG. 6.
FIG. 6.
Effect of activated STAT6 by IL-4 on KSHV replication by Tat. (A) RT-PCR analysis of GATA3, IL-4, and IL-4R mRNA expression in Tat-transfected BCBL-1 cells. GATA3, IL-4, and IL-4R mRNA expression levels in BCBL-1 cells transfected with pcDNA vector (V) or pTat (T) for 3, 6, 12, and 24 h were detected by RT-PCR. M, DNA molecular marker. β-Actin was used as an internal control to monitor the presence of amplifiable cDNA in all samples. (B) Effect of Tat on IL-4 promoter activity in BCBL-1 and NIH 3T3 cells. BCBL-1 and NIH 3T3 cells were cotransfected with pIL-4-Luc and pcDNA or pIL-4-Luc and pTat following treatment without TPA or with TPA. Luciferase activities were measured as induction. All data points were the averages of four independent experiments performed in triplicate. (C) Activation of STAT6 in Tat-transfected BCBL-1 cells. BCBL-1 cells were transfected with pcDNA vector (V) or pTat (T) for 3, 6, 12, and 24 h. Lysates were subjected to SDS-PAGE, transferred to a membrane, and then immunoblotted with the indicated anti-phospho antibody. The membrane was stripped and reprobed with the respective antibody or with antiactin to confirm equal amounts of protein in each sample. The results shown are from a representative experiment of at least three independent experiments with similar results. (D) Activation of STAT6 partially contributes to KSHV replication by Tat. Real-time quantitative PCR was used to detect relative quantities of ORF50 mRNA in BCBL-1 cells cotransfected with pcDNA and pRed vector, pcDNA and pST6-DN, pTat and pRed vector, or pTat and pST6-DN for 72, 96, and 120 h as indicated. The results from three independent experiments performed in triplicate are shown.

Similar articles

Cited by

References

    1. Agbalika, F., J. P. Marolleau, and J. C. Brouet. 2000. Interleukin-6 stimulates HHV-8 replication in bone marrow cultures and infected cell lines. Hematol. J. 1:48-52. - PubMed
    1. Aldovini, A., C. Debouck, M. B. Feinberg, M. Rosenberg, S. K. Arya, and F. Wong-Staal. 1986. Synthesis of the complete trans-activation gene product of human T-lymphotropic virus type III in Escherichia coli: demonstration of immunogenicity in vivo and expression in vitro. Proc. Natl. Acad. Sci. USA 83:6672-6676. - PMC - PubMed
    1. Ambrosino, C., M. R. Ruocco, X. Chen, M. Mallardo, F. Baudi, S. Trematerra, I. Quinto, S. Venuta, and G. Scala. 1997. HIV-1 Tat induces the expression of the interleukin-6 (IL-6) gene by binding to the IL-6 leader RNA and by interacting with CAAT enhancer-binding protein beta (NF-IL-6) transcription factors. J. Biol. Chem. 272:14883-14892. - PubMed
    1. Aoki, Y., G. M. Feldman, and G. Tosato. 2003. Inhibition of STAT3 signaling induces apoptosis and decreases survivin expression in primary effusion lymphoma. Blood 101:1535-1542. - PubMed
    1. Ariyoshi, K., M. Schim van der Loeff, P. Cook, D. Whitby, T. Corrah, S. Jaffar, F. Cham, S. Sabally, D. O'Donovan, R. A. Weiss, T. F. Schulz, and H. Whittle. 1998. Kaposi's sarcoma in the Gambia, West Africa is less frequent in human immunodeficiency virus type 2 than in human immunodeficiency virus type 1 infection despite a high prevalence of human herpesvirus 8. J. Hum. Virol. 1:193-199. - PubMed

Publication types

MeSH terms