

Evolutionary mechanisms of persistence and diversification of a calicivirus within endemically infected natural host populations
- PMID: 17151126
- PMCID: PMC1797550
- DOI: 10.1128/JVI.01981-06
Evolutionary mechanisms of persistence and diversification of a calicivirus within endemically infected natural host populations
Abstract
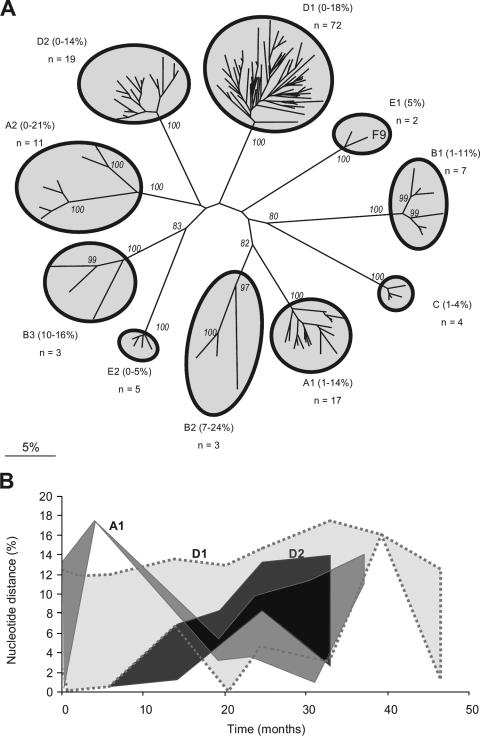
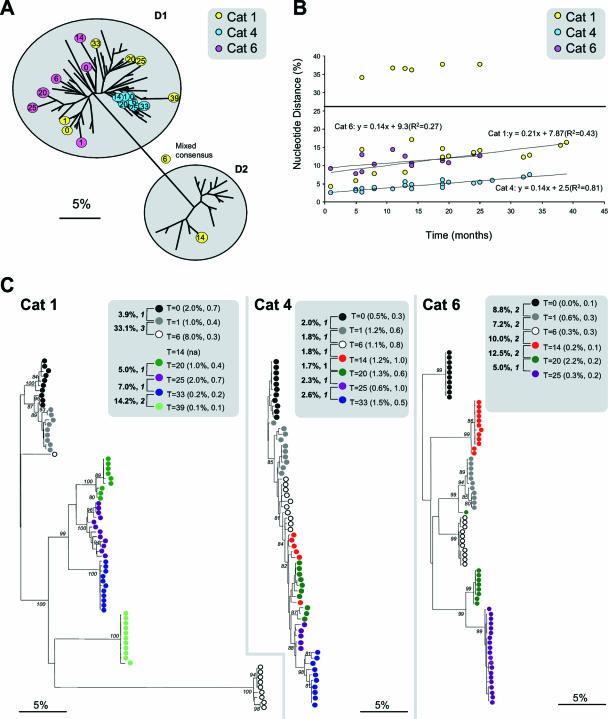
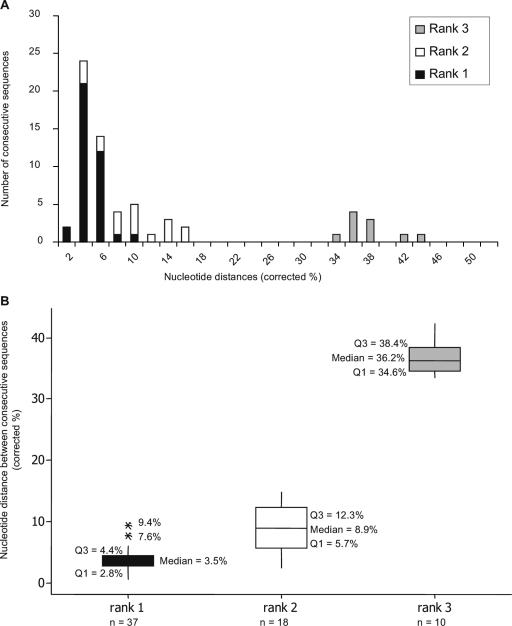
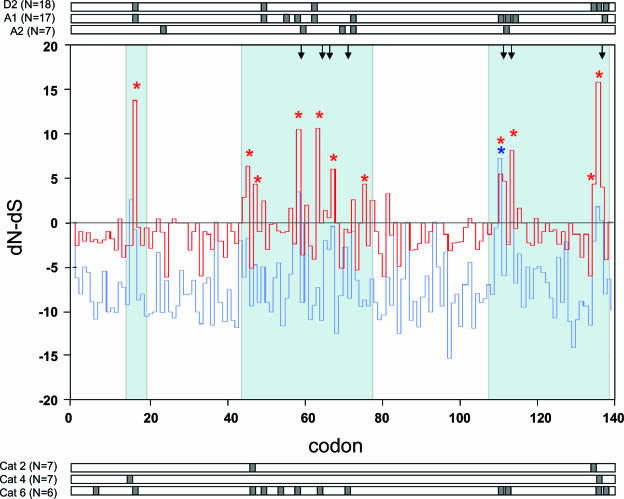
In order to understand the evolutionary mechanisms of persistence and diversification within the Caliciviridae, we have been exploiting endemic infection of feline calicivirus within five geographically distinct household groups of cats. By sequencing immunodominant and variable regions of the capsid gene, we identified the relative contribution of the different evolutionary processes employed by the virus to ensure its long-term survival in the host population. Such strategies included progressive evolution of a given variant of a strain through mutation accumulation within an individual, sequential reinfection with either a variant of the same strain or with a different strain, and mixed infection. Recombination between different strains in this study has been reported in detail elsewhere (K. P. Coyne et al., J. Gen. Virol. 87:921-926, 2006). Here, we provide evidence to suggest that true long-term persistent infection in individuals is relatively rare, with the majority of apparent viral carriers undergoing a combination of progressive evolution and cyclical reinfection. Progressive evolution at the individual level and variant reinfection at both the individual and population levels were associated with positive selection. Two measures of evolution rate were determined; for a virus progressively evolving within an individual (1.32 x 10(-2) to 2.64 x 10(-2) substitutions per nucleotide per year, i.e., no transmission) and for a strain circulating within a population (3.84 x 10(-2) to 4.56 x 10(-2) substitutions per nucleotide per year, i.e., including transmission). Reiteration of both progressive evolution and variant reinfection appeared to lead to a gradual increase in the diversity of a given strain of virus, both in the individual and in the population, until eventually new strains emerged.
Figures
References
-
- Begon, M., J. L. Harper, and C. R. Townsend. 1990. Ecology: individuals, populations and communities, 2nd ed. Blackwell Scientific Publications, Cambridge, Mass.
-
- Binns, S. H., S. Dawson, A. J. Speakman, L. E. Cuevas, C. A. Hart, C. J. Gaskell, K. L. Morgan, and R. M. Gaskell. 2000. A study of feline upper respiratory tract disease with reference to prevalence and risk factors for infection with feline calicivirus and feline herpesvirus. J. Feline Med. Surg. 2:123-133. - PMC - PubMed
-
- Carter, M. J., I. D. Milton, J. Meanger, M. Bennett, R. M. Gaskell, and P. C. Turner. 1992. The complete nucleotide sequence of a feline calicivirus. Virology 190:443-448. - PubMed
Publication types
MeSH terms
Substances
Associated data
- Actions
- Actions
- Actions
- Actions
- Actions
- Actions
- Actions
- Actions
- Actions
- Actions
- Actions
- Actions
- Actions
- Actions
- Actions
- Actions
- Actions
- Actions
- Actions
- Actions
- Actions
- Actions
- Actions
- Actions
- Actions
- Actions
- Actions
- Actions
- Actions
- Actions
- Actions
- Actions
- Actions
- Actions
- Actions
- Actions
- Actions
- Actions
- Actions
- Actions
- Actions
- Actions
- Actions
- Actions
- Actions
- Actions
- Actions
- Actions
- Actions
- Actions
- Actions
- Actions
- Actions
- Actions
- Actions
- Actions
- Actions
- Actions
- Actions
- Actions
- Actions
- Actions
- Actions
- Actions
- Actions
- Actions
- Actions
- Actions
- Actions
- Actions
- Actions
- Actions
- Actions
- Actions
- Actions
- Actions
- Actions
- Actions
- Actions
- Actions
- Actions
- Actions
- Actions
- Actions
- Actions
- Actions
- Actions
- Actions
- Actions
- Actions
- Actions
- Actions
- Actions
- Actions
- Actions
- Actions
- Actions
- Actions
- Actions
- Actions
- Actions
- Actions
- Actions
- Actions
- Actions
- Actions
- Actions
- Actions
- Actions
- Actions
- Actions
- Actions
- Actions
- Actions
- Actions
- Actions
- Actions
- Actions
- Actions
- Actions
- Actions
- Actions
- Actions
- Actions
- Actions
- Actions
- Actions
- Actions
- Actions
- Actions
- Actions
- Actions
- Actions
- Actions
- Actions
- Actions
- Actions
- Actions
- Actions
- Actions
- Actions
LinkOut - more resources
Full Text Sources
Other Literature Sources
Miscellaneous
