

The effect of genetic variation of the retinoic acid receptor-related orphan receptor C gene on fatness in cattle
- PMID: 17151246
- PMCID: PMC1800623
- DOI: 10.1534/genetics.106.064535
The effect of genetic variation of the retinoic acid receptor-related orphan receptor C gene on fatness in cattle
Abstract
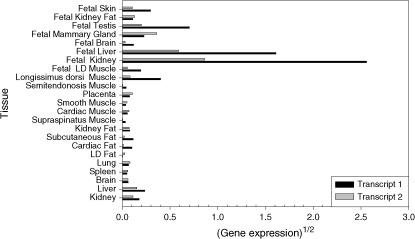
Genotypes at the retinoic acid receptor-related orphan receptor C (RORC) gene were associated with fatness in 1750 cattle. Ten SNPs were genotyped in RORC and the adjacent gene leucine-rich repeat neuronal 6D (LRRN6D) to map the QTL, 7 of which are in a 4.2-kb sequence around the ligand-binding domain of the RORC gene. Of the 29 inferred haplotypes for these SNPs, 2 have a combined frequency of 54.6% while the top 5 haplotypes have a combined frequency of 85.3%. The average D' value of linkage disequilibrium was 0.92 although the average r2 was a low 0.18. The RORC:g.3290T>G SNP had the strongest association with marbling. The inferred haplotypes were significantly associated with marbling and the difference between the most divergent haplotypes was 0.35 sigma(p) of marbling and 0.28 sigma(p) of rump fat, explaining the previously reported QTL effect. cDNA for RORC were sequenced and 2 new alternative transcripts were found. Fetal tissue shows 40 times greater transcription of RORC than adult tissue. The highest expression in fetal tissue was found in liver and kidney, but in adults the longissimus muscle had the greatest expression of the tissues tested.
Figures
References
-
- Altschul, S. F., W. Gish, W. Miller, E. W. Myers and D. J. Lipman, 1990. Basic local alignment search tool. J. Mol. Biol. 215: 403–410. - PubMed
-
- Andersson-Eklund, L., B. Danell and J. Rendel, 1990. Associations between blood-groups, blood protein polymorphisms and breeding values for production traits in Swedish red and white dairy bulls. Anim. Genet. 21: 361–376. - PubMed
-
- Anonymous, 2001. Beef and veal language. AUS-MEAT, South Brisbane, Australia (http://www.ausmeat.com.au/Sales/pdf/BV-Lang-A4.pdf).
-
- Austin, S., A. Medvedev, Z. H. Yan, H. Adachi, T. Hirose et al., 1998. Induction of the nuclear orphan receptor ROR gamma during adipocyte differentiation of D1 and 3T3–L1 cells. Cell Growth Differ. 9: 267–276. - PubMed
-
- Barendse, W., 1997. Assessing lipid metabolism. WO9923248 US 6383751, pp. 1–68.
Publication types
MeSH terms
Substances
Associated data
- Actions
- Actions
- Actions
- Actions
- Actions
LinkOut - more resources
Full Text Sources
Other Literature Sources
Medical
