. 2007 Feb;175(2):933-43.
doi: 10.1534/genetics.106.064329. Epub 2006 Dec 6.

Functional analysis of gene duplications in Saccharomyces cerevisiae

Affiliations

Functional analysis of gene duplications in Saccharomyces cerevisiae

Yuanfang Guan et al. Genetics. 2007 Feb.

Abstract

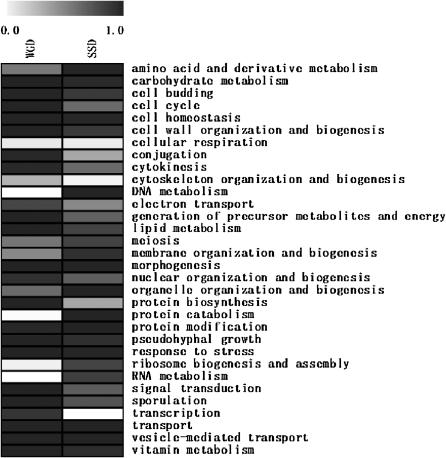
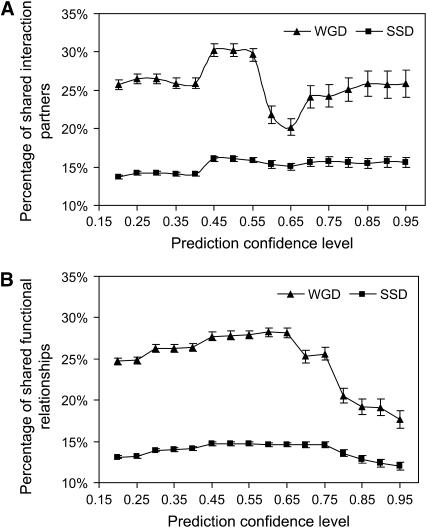
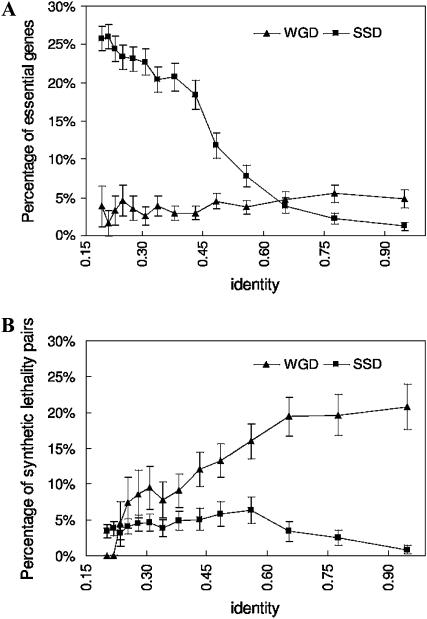
Gene duplication can occur on two scales: whole-genome duplications (WGD) and smaller-scale duplications (SSD) involving individual genes or genomic segments. Duplication may result in functionally redundant genes or diverge in function through neofunctionalization or subfunctionalization. The effect of duplication scale on functional evolution has not yet been explored, probably due to the lack of global knowledge of protein function and different times of duplication events. To address this question, we used integrated Bayesian analysis of diverse functional genomic data to accurately evaluate the extent of functional similarity and divergence between paralogs on a global scale. We found that paralogs resulting from the whole-genome duplication are more likely to share interaction partners and biological functions than smaller-scale duplicates, independent of sequence similarity. In addition, WGD paralogs show lower frequency of essential genes and higher synthetic lethality rate, but instead diverge more in expression pattern and upstream regulatory region. Thus, our analysis demonstrates that WGD paralogs generally have similar compensatory functions but diverging expression patterns, suggesting a potential of distinct evolutionary scenarios for paralogs that arose through different duplication mechanisms. Furthermore, by identifying these functional disparities between the two types of duplicates, we reconcile previous disputes on the relationship between sequence divergence and expression divergence or essentiality.


Figures

F<sc>igure</sc> 1.—
Figure 1.—
The number of duplicate pairs at each sequence divergence level. The duplicates were grouped into 23 bins with a sliding window of 400 pairs in size and 100 pairs per window slide. Such grouping is used in the following analysis that included percentage of identity. Thus adjacent bins may include the same pairs so as to smooth the pattern and identify the general trends of different attributes of the WGD and SSD sets.
F<sc>igure</sc> 2.—
Figure 2.—
Distribution of GO slim biological process annotations. Differential enrichment of GO slim biological process categories for WGD and SSD genes is shown. The graph represents the enrichment (in cumulative distribution function) of each set of genes in each GO term, in comparison to the genome average, with darker shading representing higher enrichment.
F<sc>igure</sc> 3.—
Figure 3.—
Frequency of shared interaction partners and functional relationships predicted by a Bayesian network at various confidence levels. We predicted interaction partners and functionally related proteins for each paralog on the basis of a Bayesian analysis of diverse genomic data. Then we calculated the percentage of shared interaction partners/functional relationships between paralogs over the total number of interaction partners/functional relationships of the pair. (A) A Bayesian network integrating evidence for physical interactions was used to predict interaction partners. (B) A Bayesian network integrating diverse genomic data was used to predict broad functional relationships. The WGD group shows a substantially higher percentage of shared interaction partners and functional relationships across all the Bayesian confidence levels. Fluctuations in the WGD graph are most likely due to variations in availability of different experimental data sets that served as input to the Bayesian analysis.
F<sc>igure</sc> 4.—
Figure 4.—
Propensity of sharing interaction partners and functional relationships between paralogs across sequence divergence levels. (A) Sharing of interaction partners between paralogs predicted from the Bayesian network on the basis of evidence of protein–protein interactions. (B) Sharing of functional relationships between paralogs predicted from the Bayesian network predicting functional relationships. For the same level of sequence divergence, the WGD paralogs are more likely to share protein–protein interaction partners and functional relationships. The linear relationship between sequence divergence and shared functional relationships is evident in SSD duplicates (R2 = 0.8688). In the WGD set, above 45% sequence identity such linear relationship is not observable.
F<sc>igure</sc> 5.—
Figure 5.—
Patterns of essentiality and synthetic lethality of the duplicates across sequence divergence levels. (A) The percentage of essential genes in the WGD and SSD sets. Frequency of essentiality of the SSD duplicate genes increases as the paralogous sequences diverge. In contrast, the essentiality rate stays low and at a relatively constant level for WGD genes. The SSD duplicates generally show a higher proportion of essential genes except in high sequence similarity (>60%) bins, which include 11% of the SSD set only. (B) The percentage of synthetic lethal pairs in WGD and SSD sets. The synthetic lethality rate is generally higher in WGD paralogs, which suggests compensation and functional conservation between paralogs. The synthetic lethality proportion decreases as the paralogous sequences diverge in the WGD set, whereas such a trend is not observable in the SSD set.
F<sc>igure</sc> 6.—
Figure 6.—
Divergence of the upstream regulatory region and transcription factor-binding sites between paralogs across sequence divergence. (A) Alignment of the upstream 1000 kb between pairs. The nonoverlapping percentage of identity of the upstream 1000 kb (E = 1) was calculated and the average was taken. The upstream regions between the background duplicate pair generally align better, especially at high percentage of identity groups. Such a result is in accordance with the expression pattern of which WGD pairs diverge more. (B) Alignment of the upstream 1000 kb between pairs after removal of ribosomal genes. (C) Frequency of shared transcription factor-binding sites. WGD paralogs are significantly weaker in sharing transcription factor-binding sites. (D) Frequency of shared transcription factor-binding sites between paralogs after removal of ribosomal genes.
F<sc>igure</sc> 7.—
Figure 7.—
Divergence of expression pattern between paralogs across sequence divergence. (A) The correlation of expression patterns between paralogs. Expression patterns between the WGD paralogs are highly diverged especially after the removal of ribosomal genes, indicating their role in finely modulating expression levels. The expression correlation coefficient between two random genes in the data set is on average 0.003. (B) The correlation of expression patterns between paralogs after removal of ribosomal genes.

References

    1. Altschul, S. F., W. Gish, W. Miller, E. W. Myers and D. J. Lipman, 1990. Basic local alignment search tool. J. Mol. Biol. 215: 403–410. - PubMed
    1. Ashburner, M., X. A. Ball, J. A. Blake, D. Botstein, H. Butler et al., 2000. Gene ontology: tool for the unification of biology. The Gene Ontology Consortium. Nat. Genet. 25: 25–29. - PMC - PubMed
    1. Baudot, A., B. Jacq and C. Brun, 2004. A scale of functional divergence for yeast duplicated genes revealed from analysis of the protein-protein interaction network. Genome Biol. 5: R76. - PMC - PubMed
    1. Breitkreutz, B. J., C. Stark and M. Tyers, 2003. The GRID: the General Repository for Interaction Datasets. Genome Biol. 4(3): R23. - PMC - PubMed
    1. Brem, R. B., and L. Kruglyak, 2005. The landscape of genetic complexity across 5,700 gene expression traits in yeast. Proc. Natl. Acad. Sci. USA 102(5): 1572–1577. - PMC - PubMed

Publication types