. 2007 Feb;175(2):805-17.
doi: 10.1534/genetics.106.063800. Epub 2006 Dec 6.

Effects of introgression and recombination on haplotype structure and linkage disequilibrium surrounding a locus encoding Bymovirus resistance in barley

Affiliations

Effects of introgression and recombination on haplotype structure and linkage disequilibrium surrounding a locus encoding Bymovirus resistance in barley

Silke Stracke et al. Genetics. 2007 Feb.

Abstract

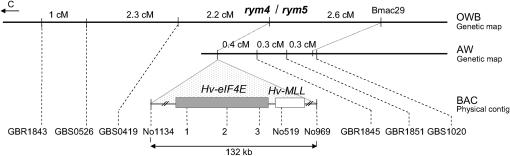
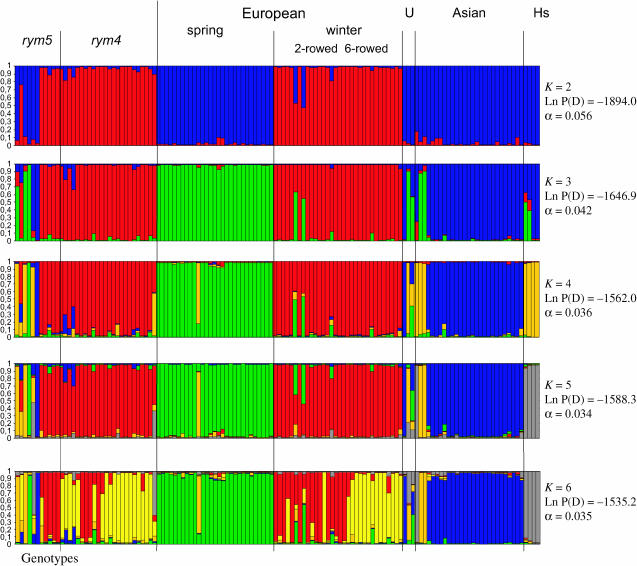
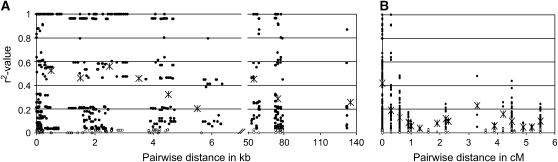
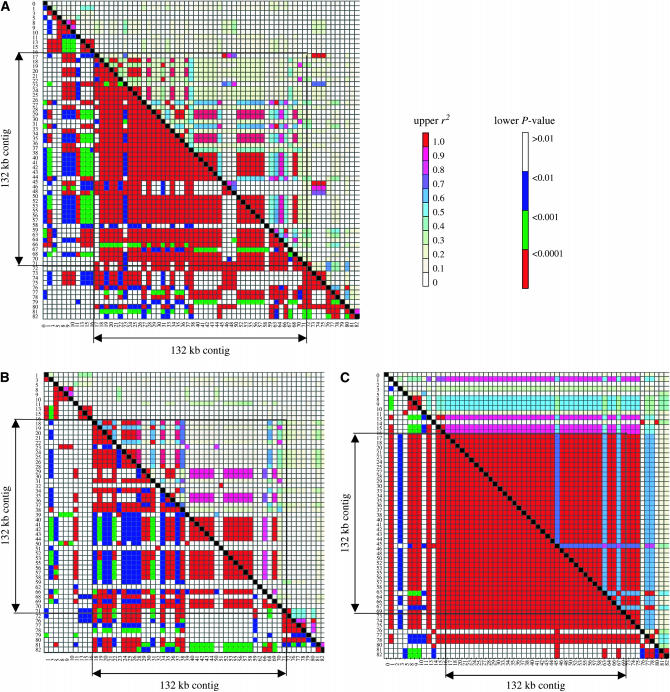
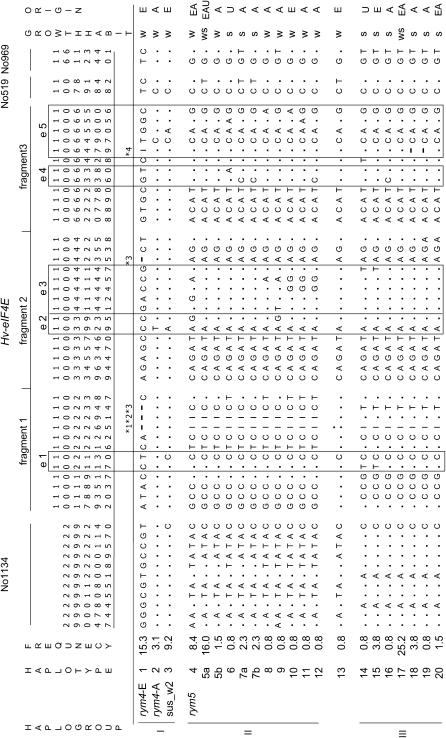
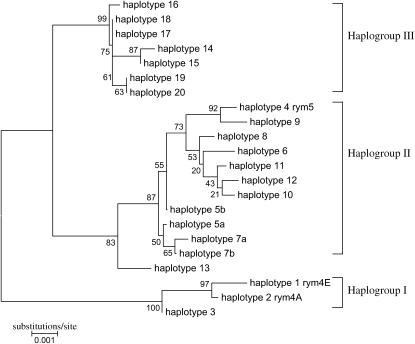
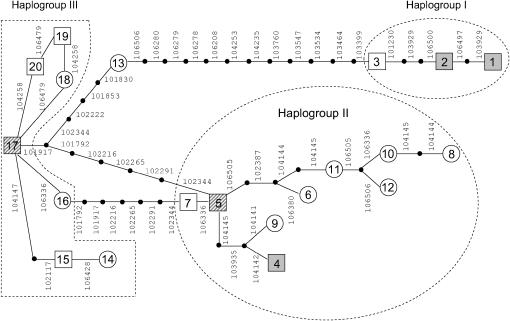
We present a detailed analysis of linkage disequilibrium (LD) in the physical and genetic context of the barley gene Hv-eIF4E, which confers resistance to the barley yellow mosaic virus (BYMV) complex. Eighty-three SNPs distributed over 132 kb of Hv-eIF4E and six additional fragments genetically mapped to its flanking region were used to derive haplotypes from 131 accessions. Three haplogroups were recognized, discriminating between the alleles rym4 and rym5, which each encode for a spectrum of resistance to BYMV. With increasing map distance, haplotypes of susceptible genotypes displayed diverse patterns driven mainly by recombination, whereas haplotype diversity within the subgroups of resistant genotypes was limited. We conclude that the breakdown of LD within 1 cM of the resistance gene was generated mainly by susceptible genotypes. Despite the LD decay, a significant association between haplotype and resistance to BYMV was detected up to a distance of 5.5 cM from the resistance gene. The LD pattern and the haplotype structure of the target chromosomal region are the result of interplay between low recombination and recent breeding history.


Figures

F<sc>igure</sc> 1.—
Figure 1.—
Combined genetic and physical map of the region surrounding Hv-eIF4E on chromosome 3H. Genetic distances in centimorgans are indicated for markers flanking the locus in the OWB and the high-resolution AW maps. The arrow indicates the centromere (C). The schematic arrangement of marker fragments is depicted (not to scale) on the physical BAC contig (AY661558). Hv-MLL, barley MCT-1-like protein.
F<sc>igure</sc> 2.—
Figure 2.—
Estimated population structure based on 16 EST–SSRs. The population can be partitioned into K subpopulations, which are color labeled. A bar, whose colored segments represent the individual's estimated contribution to the individual subpopulations, represents each accession. Black vertical lines separate accessions of different resistance phenotype, origin, and growth habit. U, America; Hs, ssp. spontaneum.
F<sc>igure</sc> 3.—
Figure 3.—
LD structure at Hv-eIF4E. Plots show the pairwise LD measurement r2 related to (A) physical, and (B) genetic distances. The data consist of 67 polymorphic sites with a minor allele frequency >0.05 in the set of 131 accessions. Nonsignificant r2 values (P > 0.05) are indicated by open dots. Mean values of r2 are given by asterisks for (A) windows of 1 and 10 kb distance and (B) identical genetic distances.
F<sc>igure</sc> 4.—
Figure 4.—
Strength and extent of LD in different germplasm sets. Polymorphic sites in the investigated interval with a minor allele frequency >5% were considered for a pairwise calculation of LD across (A) the entire collection of 131 accessions, (B) the non-rym4/rym5-resistant subpopulation of 96 accessions, and (C) the set of 35 rym4 or rym5 carriers. Each point in the LD matrix represents a comparison between a pair of polymorphic sites, with the r2 values displayed above the diagonal and the P-values for Fisher's exact test below. Points on the diagonal correspond to comparisons of each site with itself. Polymorphic sites located within the fragments of the physical contig are indicated. Color codes for r2 and P-values are given.
F<sc>igure</sc> 5.—
Figure 5.—
Polymorphic sites in the Hv-eIF4E contig. Polymorphic sites located in coding (e1, e2, etc.) and noncoding regions are designated according to their position in the AY661558 sequence. Dots indicate sites identical to haplotype 1 (rym4-E). For all indels, the starting point is given (*1, 108 bp; *2, 2 bp; *3, 1 bp; *4, 10 bp). Considering all 54 polymorphic sites, haplotypes 1–20 can be identified. Haplotypes 5 and 7 were separated into “a” and “b,” which, although sharing an identical haplotype for all three Hv-eIF4E genic fragments, differed at a site in the flanking region (haplotype 5 at No519; haplotype 7 at No969). Haplogroups I, II, and III are indicated on the left. Growth habit (w, winter; s, spring) and origin (E, Europe; A, Asia; U, America) are given for each haplotype.
F<sc>igure</sc> 6.—
Figure 6.—
Haplotype relationships within 132-kb interval. The midpoint-rooted neighbor-joining tree is based on the sequence of No1134, Hv-eIF4E fragments 1–3, No519, and No969 of the 22 haplotypes designated in Figure 5. The numbers on the branches indicate the frequency (%) with which a clade appeared in 1000 bootstrap samples. Branch lengths are proportional to the probable number of substitutions per site using Kimura two-parameter distances. Haplogroups I, II, and III are indicated.
F<sc>igure</sc> 7.—
Figure 7.—
The Hv-eIF4E haplotype network. Numbers correspond to the haplotype designations in Figure 5. Lines represent mutational changes and solid circles indicate intermediate haplotypes. The 95% confidence interval is 13 steps. Haplotypes shared between more than one genotype are indicated by squares. Shaded squares correspond to rym4-E (1), rym4-A (2), and rym5 (4) haplotypes, respectively. Haplotypes showing strong independence from growth habit and origin are marked with a hatched pattern. Haplogroups I, II, and III are indicated.

References

    1. Abdel-Ghani, A. H., H. K. Parzies, S. Ceccarelli, S. Grando and H. H. Geiger, 2005. Estimation of quantitative genetic parameters for outcrossing-related traits in barley. Crop Sci. 45: 98–105.
    1. Akey, J. M., K. Zhang, M. M. Xiong and L. Jin, 2003. The effect of single nucleotide polymorphism identification strategies on estimates of linkage disequilibrium. Mol. Biol. Evol. 20: 232–242. - PubMed
    1. Anderson, J. A., G. A. Churchill, J. E. Autrique, S. D. Tanksley and M. E. Sorrells, 1993. Optimizing parental selection for genetic-linkage maps. Genome 36: 181–186. - PubMed
    1. Aranzana, M. J., S. Kim, K. Zhao, E. Bakker, M. Horton et al., 2005. Genome-wide association mapping in Arabidopsis identifies previously known flowering time and pathogen resistance genes. PLoS Genet. 1: e60. - PMC - PubMed
    1. Badr, A., K. Muller, R. Schafer-Pregl, H. El Rabey, S. Effgen et al., 2000. On the origin and domestication history of barley (Hordeum vulgare). Mol. Biol. Evol. 17: 499–510. - PubMed

Substances