Comparative Study
. 2006 Dec 6;26(49):12717-26.
doi: 10.1523/JNEUROSCI.3502-06.2006.

Plasticity compartments in basal dendrites of neocortical pyramidal neurons

Affiliations
Comparative Study

Plasticity compartments in basal dendrites of neocortical pyramidal neurons

Urit Gordon et al. J Neurosci. .

Abstract

Synaptic plasticity rules widely determine how cortical networks develop and store information. Using confocal imaging and dual site focal synaptic stimulation, we show that basal dendrites, which receive the majority of synapses innervating neocortical pyramidal neurons, contain two compartments with respect to plasticity rules. Synapses innervating the proximal basal tree are easily modified when paired with the global activity of the neuron. In contrast, synapses innervating the distal basal tree fail to change in response to global suprathreshold activity or local dendritic spikes. These synapses can undergo long-term potentiation under unusual conditions when local NMDA spikes, which evoke large calcium transients, are paired with a "gating molecule," BDNF. Moreover, these synapses use a new temporal plasticity rule, which is an order of magnitude longer than spike timing dependent plasticity and prefers reversed presynaptic/postsynaptic activation order. The newly described plasticity compartmentalization of basal dendrites expands the networks plasticity rules and may support different learning and developmental functions.


Figures

Figure 1.
Figure 1.
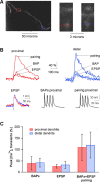
Differential response to pairing induction protocol of proximal versus distal synapses in basal dendrites. A, Experimental setup. A layer 5 pyramidal neuron was loaded with OGB-1 (200 μm), and two theta-stimulating electrodes were positioned, one proximal (red, 70 μm from the soma) and one distal (blue, 200 μm from the soma). Calcium transients evoked by small EPSPs (1–2 mV) from proximal (red box) and distal (blue box) regions were collected in the line scan mode. Graphical representation (ΔF/F as a percentage) is shown for three different regions of the line scan marked by the numbers 1–3 (red numbers, proximal; blue numbers, distal). The regions marked by 2 show significant calcium transients, whereas in regions 1 and 3, the calcium transients are markedly diminished. Scale bar, 50 μm. B, LTP was induced using a pairing protocol consisting of a burst of BAPs (top; 4 action potentials; 50 Hz), delivered 10 ms after a single EPSP. Example EPSP traces (average of 15 traces) before (30 min) and after (50 min) induction of the proximal (red) and distal EPSPs (blue) are shown. Note that only the proximally generated EPSPs underwent LTP, whereas the distally generated EPSPs were slightly depressed. C, Peak EPSPs originating from the proximal (red) and distal (blue) were measured simultaneously at the soma before and after induction (black bar, induction period). D, Summary of normalized average data from 22 proximal and 14 distal dendritic locations (red, proximal regions; blue, distal regions) shows strong potentiation at proximal synapses and slight depression at distal synapses. Two main reasons caused the slower time course in the averaged potentiation curve compared with the example presented in C. First, in some neurons, potentiation occurred gradually. Second, there were differences in the timing of the step-like potentiation between different neurons. Error bars represent SEM.
Figure 2.
Figure 2.
Calcium transients in proximal and distal basal dendrites. A, Experimental setup. A basal branch of a layer 5 pyramidal neuron loaded with OGB-6 (1 mm). Calcium imaging was performed from a proximal (red) and a distal (blue) region. Calcium imaging measurements were collected from dendritic spines both in the proximal region (dotted red line) and the distal region (dotted blue line). B, Calcium transients presented as ΔF/F (%) were evoked for proximal (red) and distal (blue) regions by local EPSPs (bottom left), a train of four BAPs (bottom middle), and pairing of a train of four BAPs with local EPSPs (bottom right). C, A summary plot of the peak calcium transients at proximal and distal regions evoked by a train of BAPs, EPSP, and pairing of a train of BAPs and EPSP (as in the induction protocol) is presented. All measurements were done with OGB-6 (0.5–1 mm). Note that no significant difference in the calcium transients was observed between proximal and distal regions in all stimulus paradigms used (p values were not significant for all three comparisons). Error bars represent SD.
Figure 3.
Figure 3.
NMDA spikes in basal dendrites of layer 2–3 pyramidal neurons. A, Experimental set up: a layer 2–3 pyramidal neuron was loaded with OGB-6 (500 μm), and a theta-stimulating electrode (shown schematically) was placed close to a distal region (120 μm from the soma). B, Postsynaptic voltage responses evoked by two stimuli at 100 Hz are shown for different stimulus intensities. The stimulus intensity was increased gradually until an all-or-none local spike was initiated. The peaks of the postsynaptic voltage responses are plotted as a function of the synaptic stimulus intensity (right). C, Calcium transients obtained from an activated dendritic spine evoked by a local dendritic spike, a burst of four action potentials (100 Hz), and an EPSP (2 mV at the soma). D, NMDA spikes evoked by UV-laser uncaging of glutamate (Left, experimental set up shown schematically). Caged glutamate (MNI-glutamate, 5 mm) was delivered by pressure ejection locally through an electrode (2 μm tip diameter, 5 mbar). Middle, Single traces of the postsynaptic voltage response evoked by glutamate uncaging at increasing laser intensities in control conditions (red) and after addition of TTX (1 μm), cadmium (100 μm), and nickel (100 μm) (blue). Adding APV to the cocktail of blockers (50 μm; black) blocked the spike. Right, The peak postsynaptic amplitude is plotted as a function of the laser intensities for control conditions, in the presence of TTX, cadmium, and nickel (red) and in the presence of TTX, cadmium, nickel, and APV (black).
Figure 4.
Figure 4.
NMDA spikes fail to induce LTP in basal dendrites of neocortical pyramidal neurons. A, Induction protocol. NMDA spikes (2 stimuli at 50 Hz) were repeated 30 times at 0.1 Hz. B, Control individual response EPSP amplitudes were recorded (0.06 Hz) before (10 min) and after the induction protocol of NMDA spikes (50 min). C, Average unitary EPSPs before (blue) and after (red) induction protocol were identical. D, Summary data of 48 experiments presenting normalized average EPSP amplitude before and after the induction show no significant change. Error bars represent SEM.
Figure 5.
Figure 5.
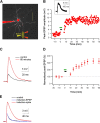
Pairing of NMDA spikes and BDNF is necessary for LTP induction in distal basal dendritic regions. A, Experimental setting. A layer 2–3 pyramidal neuron was loaded with OGB-1 (200 μm). Two stimulating electrodes (red) and a third electrode used to deliver BDNF (yellow; 50 ng/ml) were positioned near a basal dendrite. B, Peak EPSP amplitude before and after the induction protocol (black, voltage stimulation; green, BDNF application). The inset shows the induction protocol. NMDA spikes (15, 0.1 Hz) were delivered concomitant to local BDNF injection. C, A comparison of an average EPSP before the induction (10 min; black), after the induction (60 min; red), and in the presence of APV (blue) is shown. Note the large increase in the AMPA component. D, A summary plot of a normalized average of 16 similar experiments shows a large potentiation after this induction protocol (319 ± 116%). E, As a control to the requirement of NMDA spikes, the same protocol was repeated, but instead of evoking spikes, only local EPSPs were evoked (black, control; blue, 40 min after EPSP induction). Later, in the same dendrite, a second induction was performed with local NMDA spikes (red trace; 40 min after induction). The cell in B, C is different from the cell in E. Error bars represent SEM.
Figure 6.
Figure 6.
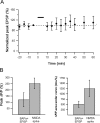
Pairing protocol in the presence of BDNF did not induce LTP in distal basal dendrites. A, Pairing BAPs with EPSPs (10 ms delay) in the presence of BDNF did not induce LTP in distal basal dendrites. The pairing protocol consisted of a burst of BAPs (4 BAPs; 100–150 Hz), delivered 10 ms after a single EPSP in the presence of local application of BDNF. A summary plot of a normalized average of 12 experiments using this protocol is shown. Error bars indicate SEM. B, Comparison of the averaged (mean ± SD) peak calcium transients (left) and area under the curve (right) evoked by pairing of BAPs and EPSP and NMDA spikes.
Figure 7.
Figure 7.
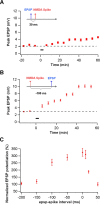
A large time window for plasticity after induction with NMDA spikes. Two stimulating electrodes were positioned (40 μm apart) at a basal dendrite. The time delay between an EPSP evoked with one electrode and a spike evoked with a second electrode was changed from 50 ms (EPSP before spike) to −200 ms (EPSP after spike). All inductions were performed in the presence of BDNF delivered locally with a third electrode. A, Example experiment presenting average peak in control and after induction protocol using a time delay of 20 ms (inset, EPSP before spike). B, Same as A, except that the time delay was −100 ms (inset, EPSP after spike). C, Normalized average summary before and after induction at delays from 50 ms to −200 ms from 42 experiments. Note the large time window of ∼150 ms opened by the NMDA spike for plasticity. Error bars represent SEM.

Similar articles

Cited by

References

    1. Adachi N, Kohara K, Tsumoto T. Difference in trafficking of brain-derived neurotrophic factor between axons and dendrites of cortical neurons, revealed by live-cell imaging. BMC Neurosci. 2005;6:42. - PMC - PubMed
    1. Aicardi G, Argilli E, Cappello S, Santi S, Riccio M, Thoenen H, Canossa M. Induction of long-term potentiation and depression is reflected by corresponding changes in secretion of endogenous brain-derived neurotrophic factor. Proc Natl Acad Sci USA. 2004;101:15788–15792. - PMC - PubMed
    1. Altar CA, DiStefano PS. Neurotrophin trafficking by anterograde transport. Trends Neurosci. 1998;10:433–437. - PubMed
    1. Artola A, Singer W. Long-term depression of excitatory synaptic transmission and its relationship to long-term potentiation. Trends Neurosci. 1993;16:480–487. - PubMed
    1. Bastian J, Chacron MJ, Maler L. Plastic and nonplastic pyramidal cells perform unique roles in a network capable of adaptive redundancy reduction. Neuron. 2004;41:767–779. - PubMed

Publication types