Comparative Study
. 2006 Dec 6;26(49):12826-37.
doi: 10.1523/JNEUROSCI.4937-05.2006.

Toll-like receptor 2 signaling in response to brain injury: an innate bridge to neuroinflammation

Affiliations
Comparative Study

Toll-like receptor 2 signaling in response to brain injury: an innate bridge to neuroinflammation

Alicia A Babcock et al. J Neurosci. .

Abstract

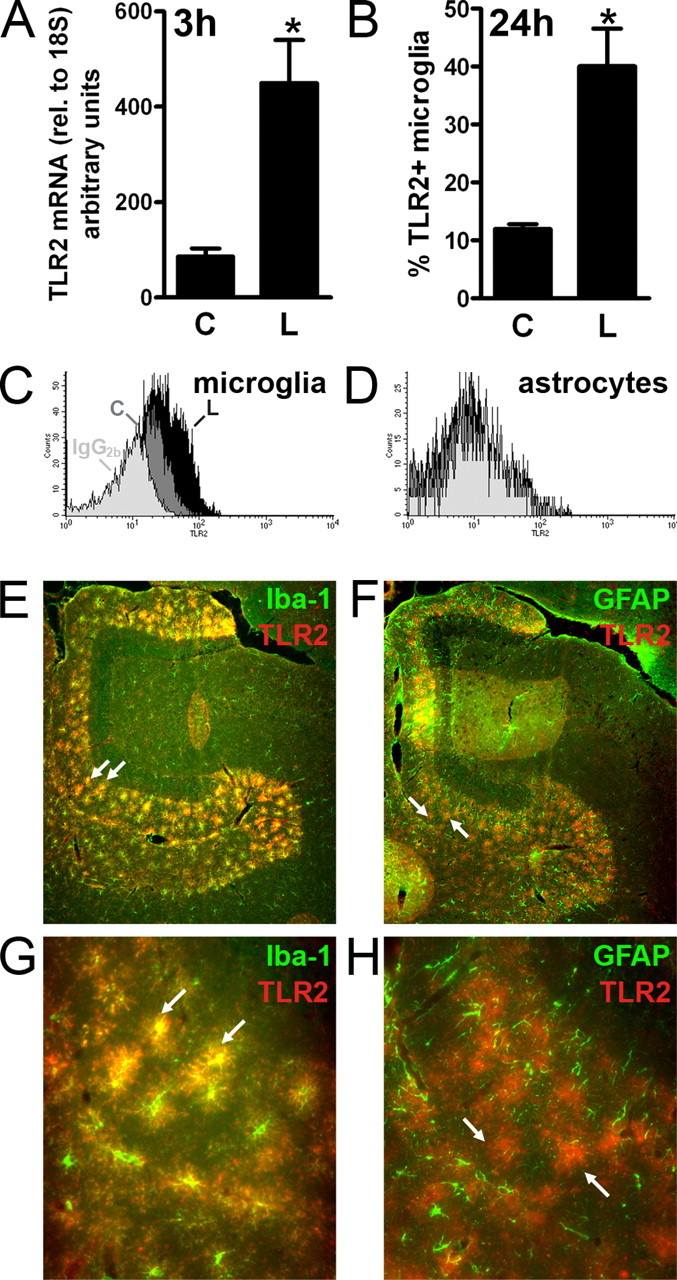
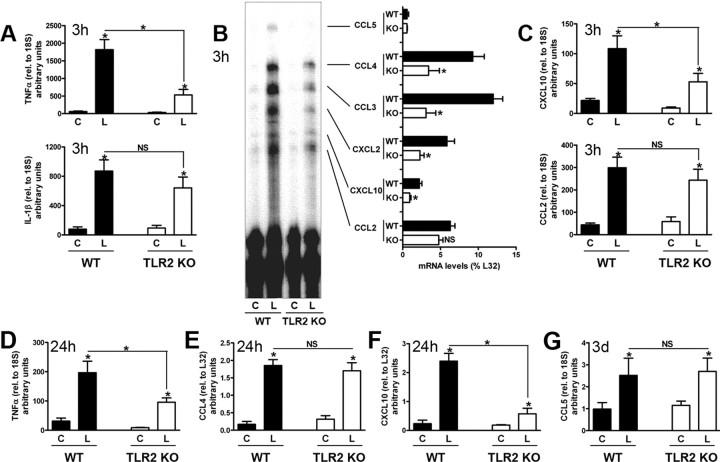
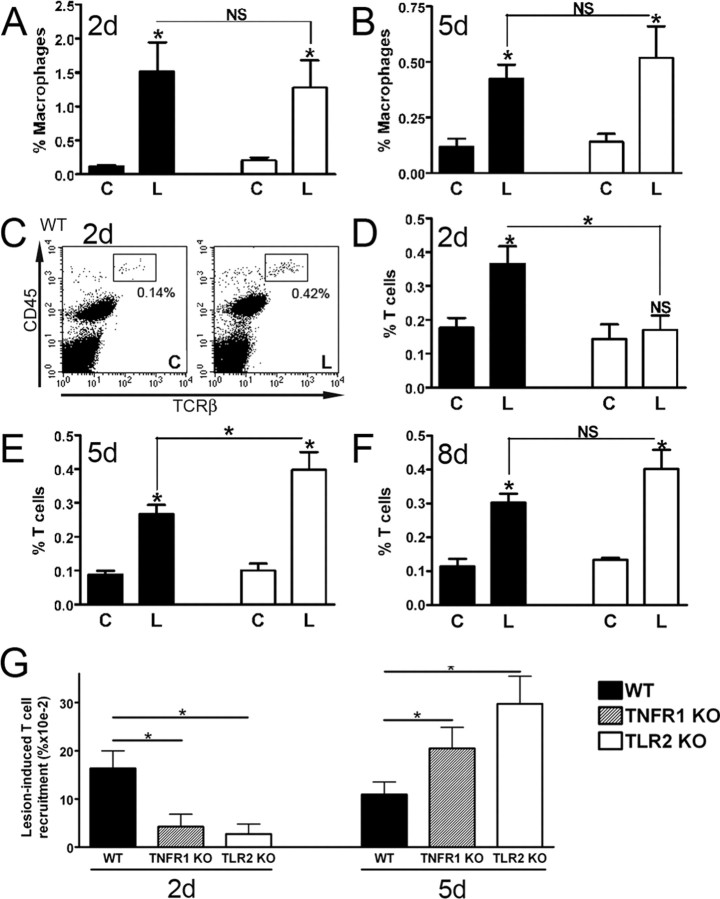
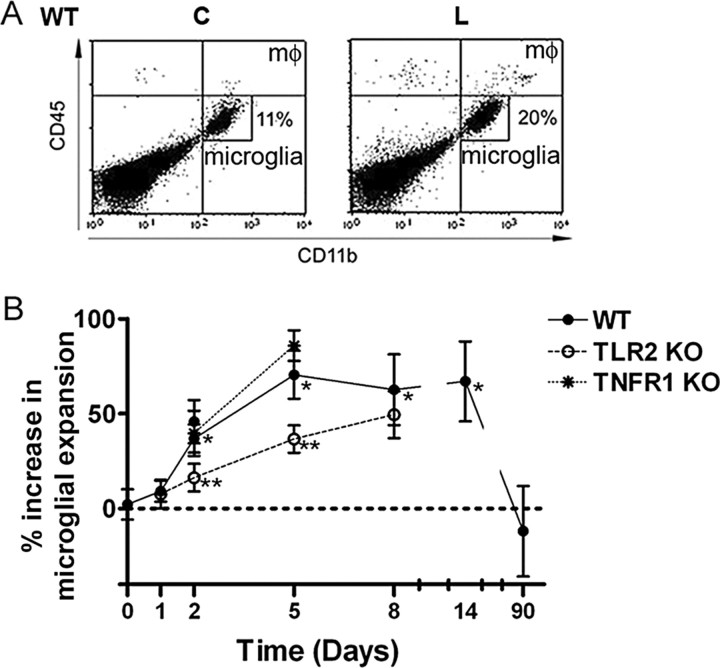
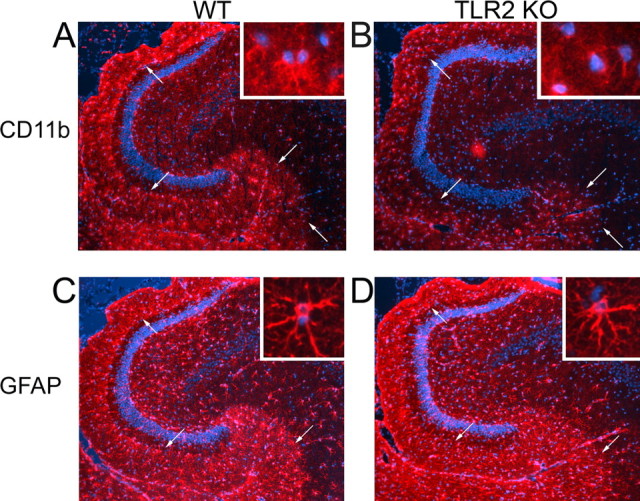
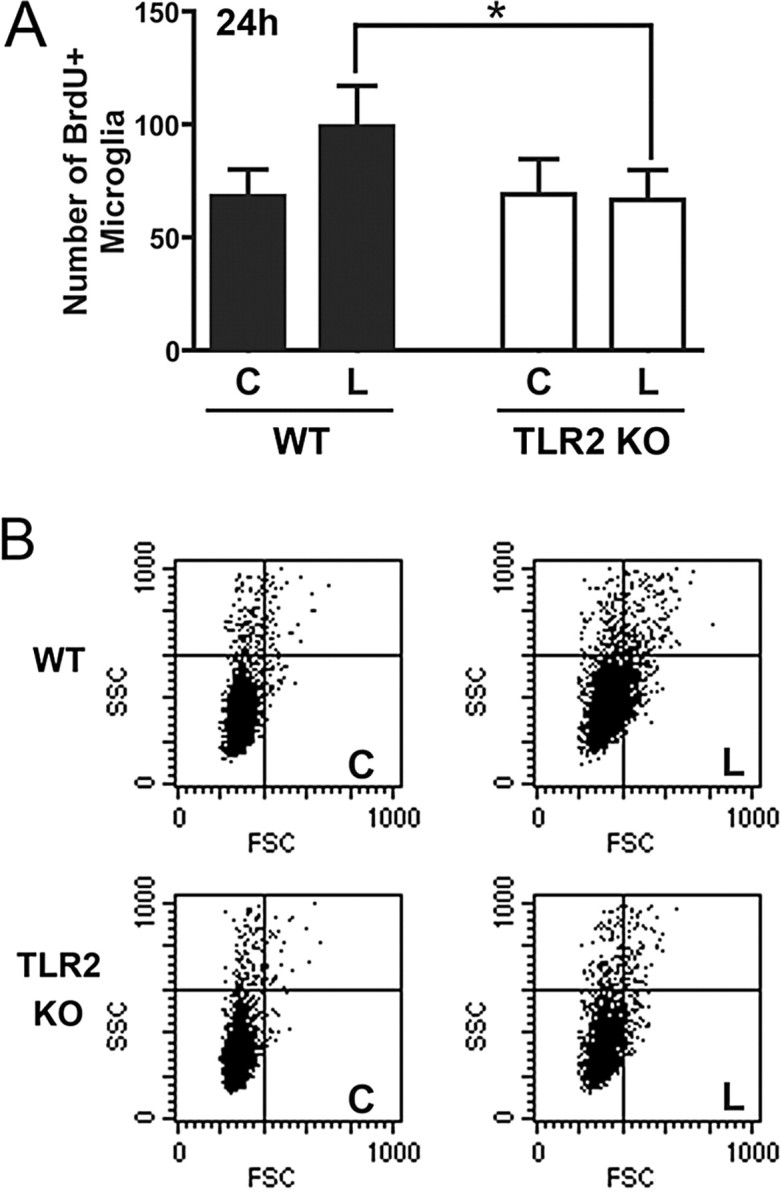
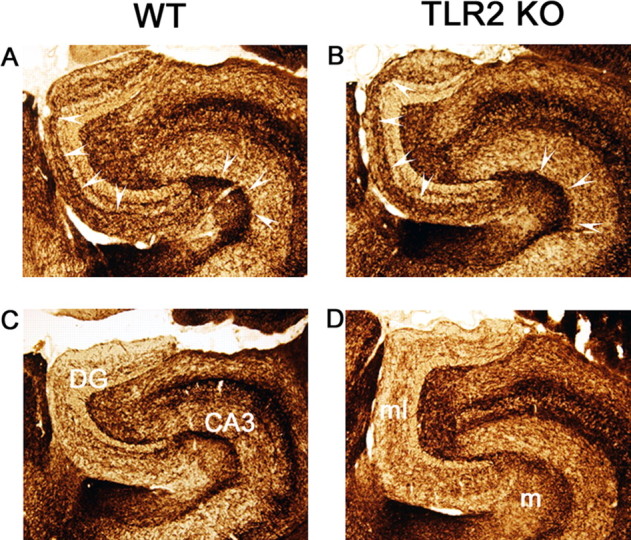
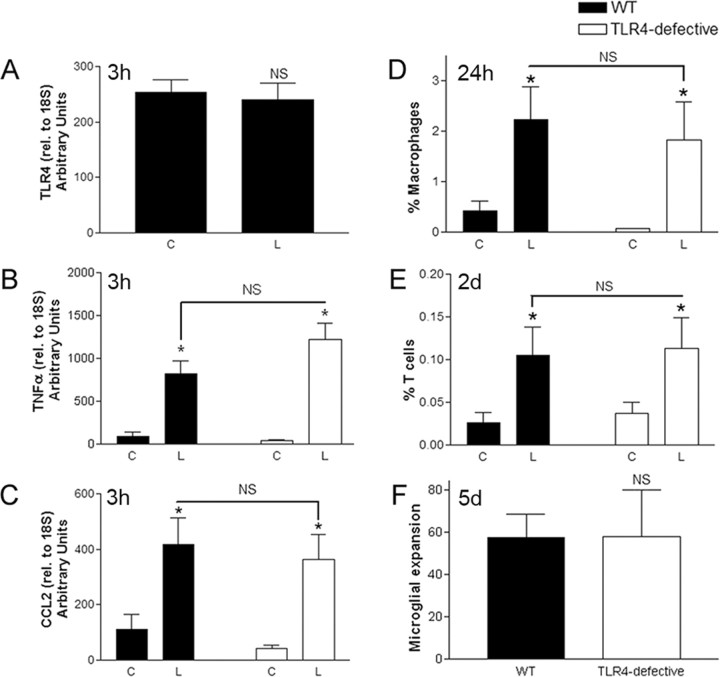
Reactive gliosis is a prominent feature of neurodegenerative and neuroinflammatory disease in the CNS, yet the stimuli that drive this response are not known. There is growing appreciation that signaling through Toll-like receptors (TLRs), which is key to generating innate responses to infection, may have pathogen-independent roles. We show that TLR2 was selectively upregulated by microglia in the denervated zones of the hippocampus in response to stereotactic transection of axons in the entorhinal cortex. In mice lacking TLR2, there were transient, selective reductions in lesion-induced expression of cytokines and chemokines. Recruitment of T cells, but not macrophages, was delayed in TLR2-deficient mice, as well as in mice lacking TNFR1 (tumor necrosis factor receptor 1). TLR2 deficiency also affected microglial proliferative expansion, whereas all of these events were unaffected in TLR4-mutant mice. Consistent with the fact that responses in knock-out mice had all returned to wild-type levels by 8 d, there was no evidence for effects on neuronal plasticity at 20 d. These results identify a role for TLR2 signaling in the early glial response to brain injury, acting as an innate bridge to neuroinflammation.


Figures

Figure 1.
Figure 1.
TLR2 is upregulated by microglia in denervated zones of the hippocampus. A, Levels of TLR2 mRNA, measured by quantitative RT-PCR and normalized to 18S, were increased in lesion-reactive hippocampi (L) from C57BL/6 mice relative to contralateral hippocampi (C) at 3 h (n = 10). Results are expressed as mean ± SE. B, Flow cytometric quantification of percentage CD11b+CD45dim microglia from contralateral (C) and lesion-reactive (L) hippocampi that stained with a monoclonal antibody specific for TLR2 24 h after lesion (n = 4). Asterisks in A and B indicate statistically significant differences between C and L (p < 0.05). C, Representative histogram overlay shows positive staining with anti-TLR2 of CD11b+CD45dim microglia from lesion-reactive hippocampus (L) (black profiles) versus staining of microglia from contralateral hippocampus (C) (dark gray profiles), relative to background staining with an IgG2b isotype control antibody (light gray profiles). D, Similar to C except that TLR2 staining was gated on GFAP+ cells. E, G, Immunofluorescence photomicrographs of the outer molecular layer of the dentate gyrus from a lesion-reactive hippocampus, stained with anti-iba-1 (green) and anti-TLR2 (red), 3 d after lesion. The zone of glial reactivity is clearly defined by reactive iba-1+ microglia. Many of these are double stained for TLR2, with the combined green and red fluorescence shown as yellow (2 examples are indicated by arrows). F, H, Similar to E, G, except that reactive astrocytes are stained in green with anti-GFAP. Reactive astrocytes and microglia define an overlapping zone of glial response. Reactive astrocytes do not double stain with anti-TLR2, because green and red cells do not coincide. The arrows indicate two examples of TLR2+ (red) cells that do not express GFAP. Original magnifications: E, F, 10×; G, H, 40×.
Figure 2.
Figure 2.
Selective effects of TLR2 signaling on early cytokine/chemokine expression induced by axonal injury. Cytokine and chemokine transcripts were measured in contralateral (C) and lesion-reactive (L) hippocampi from WT and TLR2-deficient mice by quantitative real-time PCR (A, C, D, G; n = 7–10) or RPA (B, E, F; n = 3) at times indicated (3 h, 24 h, or 3 d). Cytokine and chemokine mRNA levels measured by real-time PCR were normalized to 18S, and those measured by RPA to levels of L32. Values are expressed as arbitrary units and cannot be compared between panels. Results are expressed as mean ± SE. NS, Not statistically significant. *p < 0.05.
Figure 3.
Figure 3.
TLR2 deficiency delays infiltration by T cells but not macrophages. Flow-cytometric evaluation of the proportion of CD11b+CD45high macrophages at 2 d (A) and 5 d (B) after lesion in contralateral (C) and lesion-reactive (L) hippocampi showed no differences in macrophage infiltration between WT and TLR2-deficient (TLR2 KO) mice (n = 7). C, Flow cytometry profiles show an increased proportion of TCRβ+CD45high T cells (boxes) in lesion-reactive hippocampus (L) versus contralateral hippocampus (C) at 2 d after lesion. Quantification of proportions of TCRβ+ cells at 2 d (D), 5 d (E), and 8 d (F) revealed delayed T cell infiltration in TLR2-deficient mice (n = 6–8). G, Analysis of TNFR1-deficient (TNFR1 KO) mice at 2 and 5 d after lesion shows delayed lesion-induced T cell recruitment, as for TLR2-deficient mice. Data are presented as T cell proportions in the lesion-reactive hippocampus relative to the contralateral hippocampus, on an individual mouse basis. Results are expressed as mean ± SE. NS, Not statistically significant. *p < 0.05.
Figure 4.
Figure 4.
TLR2 deficiency impairs microglial expansion. A, The proportion of CD11b+CD45dim microglia increased in lesion-reactive hippocampi (L) from wild-type mice (WT) relative to contralateral hippocampi (C) after axonal lesion (bottom right quadrants; shown for 8 d after lesion). Microglia were clearly distinguished from macrophages (mφ), which expressed higher levels of CD45 (CD45high; top right quadrants). B, Quantification shows that percentage increase in microglial expansion relative to the contralateral hippocampus became statistically significant from 2 d after lesion and that expansion at 2 and 5 d was similar in TNFR1-deficient mice as in WT. Expansion was significantly reduced in TLR2-deficient mice at 2 and 5 d but returned to WT levels at 8 d (n = 5–16, except 90 d where n = 2). Results are expressed as mean ± SE. *p < 0.05.
Figure 5.
Figure 5.
TLR2 signaling affects microglial, but not astroglial reactivity in denervated zones. AD, CD11b (A, B) and GFAP (C, D) staining in lesion-reactive hippocampi of WT and TLR2-deficient mice at 5 d after lesion (n = 4). The arrows delineate reactive zones. The insets show high magnification images of microglia and astrocytes from the denervated outer molecular layer of the dentate gyrus. A, Inset, shows a cell doublet, consistent with proliferation, and an isolated CD11b+ cell. The morphology of cells identified by nuclear staining in the inset in B is less clearly defined because of weak CD11b staining. The GFAP staining shows the well defined laminar organization of glial response characteristic of the entorhinal lesion. Original magnification, 10 and 40×.
Figure 6.
Figure 6.
TLR2 deficiency impairs early microglial response. A, Microglial proliferation was assessed by BrdU incorporation by CD11b+CD45dim microglia in the lesion-reactive (L) and contralateral (C) hippocampi of WT and TLR2-deficient (TLR2 KO) mice at 24 h. Results are expressed as mean ± SE. *p < 0.05. B, The physical properties of microglial populations in contralateral and lesion-reactive hippocampi are shown on FSC/SSC dot plots, which are gated on CD11b+CD45dim (microglial) cells.
Figure 7.
Figure 7.
TLR2 deficiency has no effect on lesion-induced plasticity of AChE-positive cholinergic afferents. AChE staining of lesion-reactive (top panels) and unlesioned contralateral (bottom panels) hippocampus from WT (A, C) and TLR2-deficient (TLR2 KO) (B, D) mice. The arrowheads delineate the characteristic lesion-induced increase in AChE staining intensity in the inner part of the outer molecular layer of the dentate gyrus (DG), and in the molecular layer (m) of CA3. AChE staining is similar in TLR2-deficient and wild-type mice, 20 d after lesion. ml, Dentate molecular layer; m, stratum moleculare of CA3. Original magnification, 10×.
Figure 8.
Figure 8.
TLR4 signaling does not regulate innate responses to axonal injury. Quantitative RT-PCR showing no increase in TLR4 mRNA in lesion-reactive (L) versus contralateral (C) hippocampi in C57BL/6 (WT) mice (n = 9) (A), and no difference in TNFα (B) or CCL2 (C) levels between C3H/HeJ (TLR4-defective) and C3H/HeN (WT) mice at 3 h after lesion, after normalization to 18S. Flow cytometry showed similar proportions of infiltrating macrophages at 24 h (D) and T cells at 2 d (E), as well as microglial expansion at 5 d (F). Results are expressed as mean ± SE. NS, Not statistically significant. *p < 0.05.

References

    1. Akira S, Takeda K. Toll-like receptor signalling. Nat Rev Immunol. 2004;4:499–511. - PubMed
    1. Asea A, Rehli M, Kabingu E, Boch JA, Bare O, Auron PE, Stevenson MA, Calderwood SK. Novel signal transduction pathway utilized by extracellular HSP70: role of toll-like receptor (TLR) 2 and TLR4. J Biol Chem. 2002;277:15028–15034. - PubMed
    1. Babcock A, Owens T. Chemokines in experimental autoimmune encephalomyelitis and multiple sclerosis. Adv Exp Med Biol. 2003;520:120–132. - PubMed
    1. Babcock AA, Kuziel WA, Rivest S, Owens T. Chemokine expression by glial cells directs leukocytes to sites of axonal injury in the CNS. J Neurosci. 2003;23:7922–7930. - PMC - PubMed
    1. Bechmann I, Nitsch R. Involvement of non-neuronal cells in entorhinal-hippocampal reorganization following lesions. Ann NY Acad Sci. 2000;911:192–206. - PubMed

Publication types

MeSH terms

Substances

LinkOut - more resources