

Hypothalamic and brainstem sources of pituitary adenylate cyclase-activating polypeptide nerve fibers innervating the hypothalamic paraventricular nucleus in the rat
- PMID: 17154257
- PMCID: PMC1934940
- DOI: 10.1002/cne.21212
Hypothalamic and brainstem sources of pituitary adenylate cyclase-activating polypeptide nerve fibers innervating the hypothalamic paraventricular nucleus in the rat
Abstract
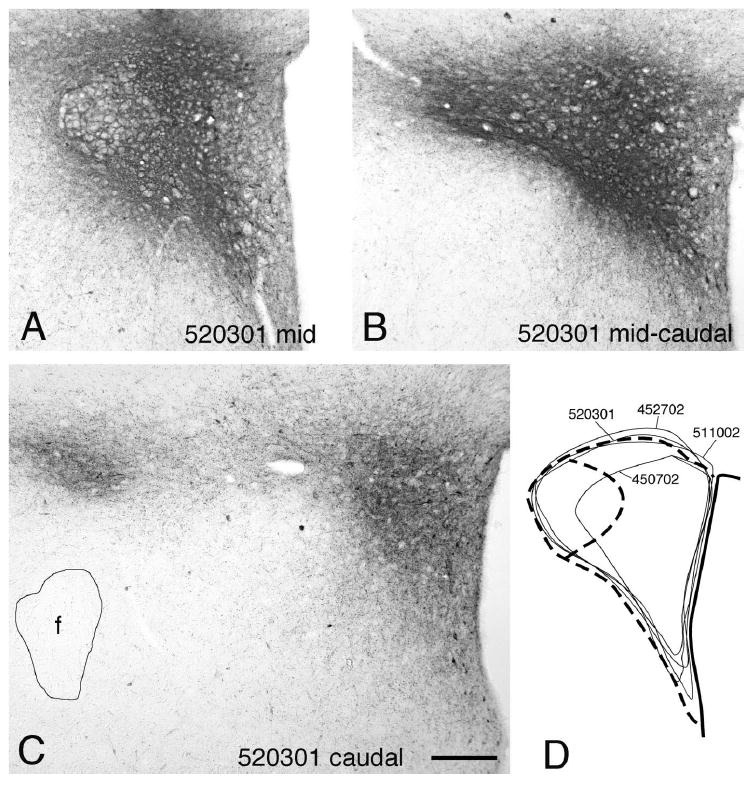
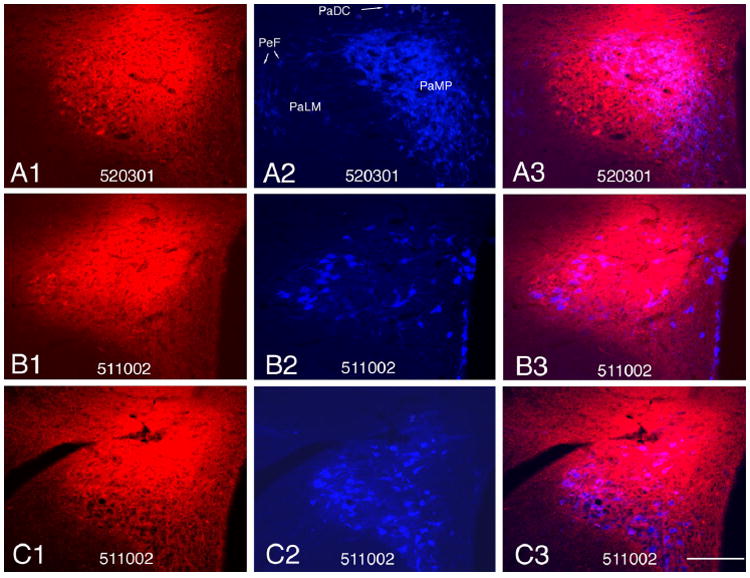
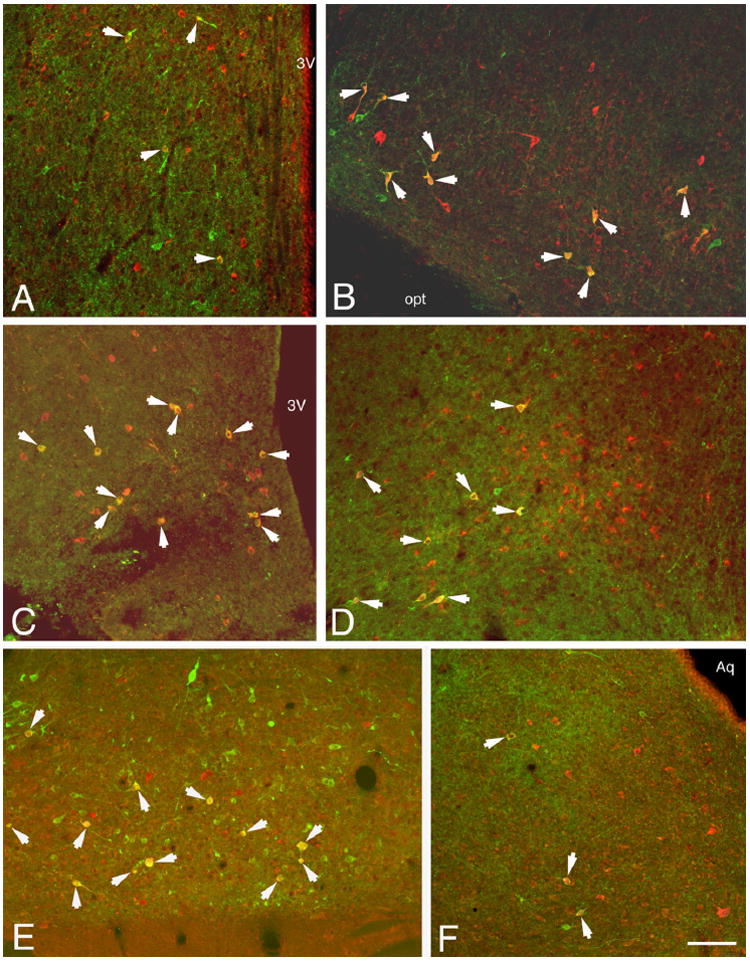
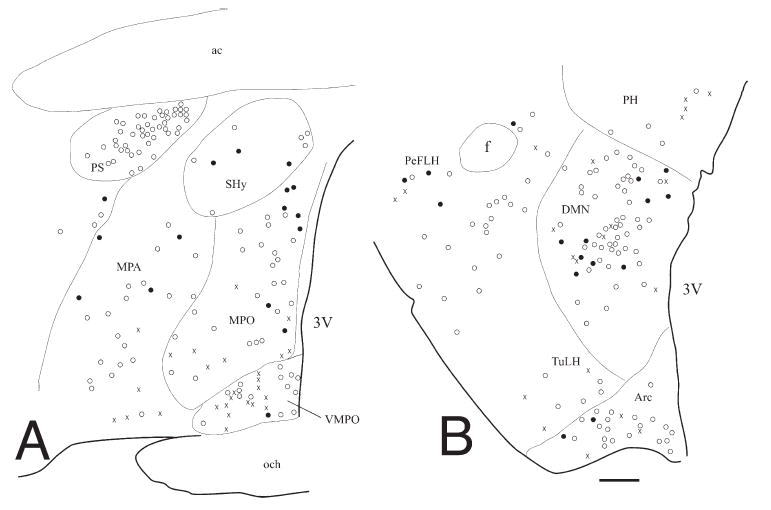
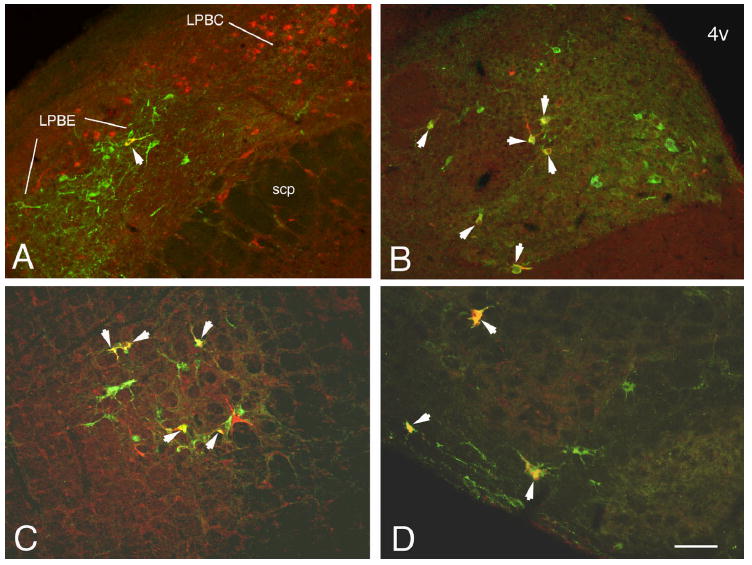
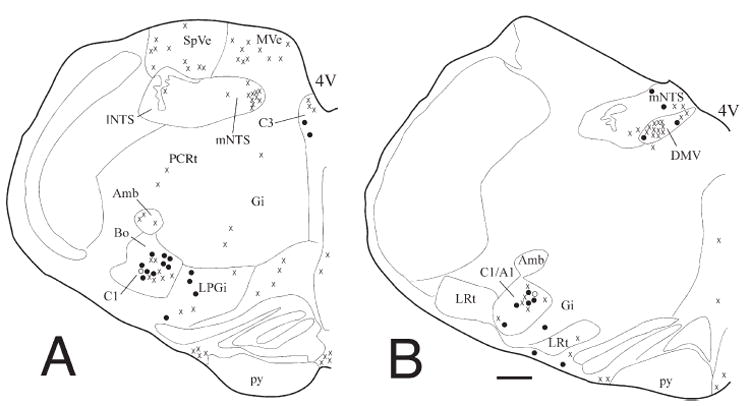
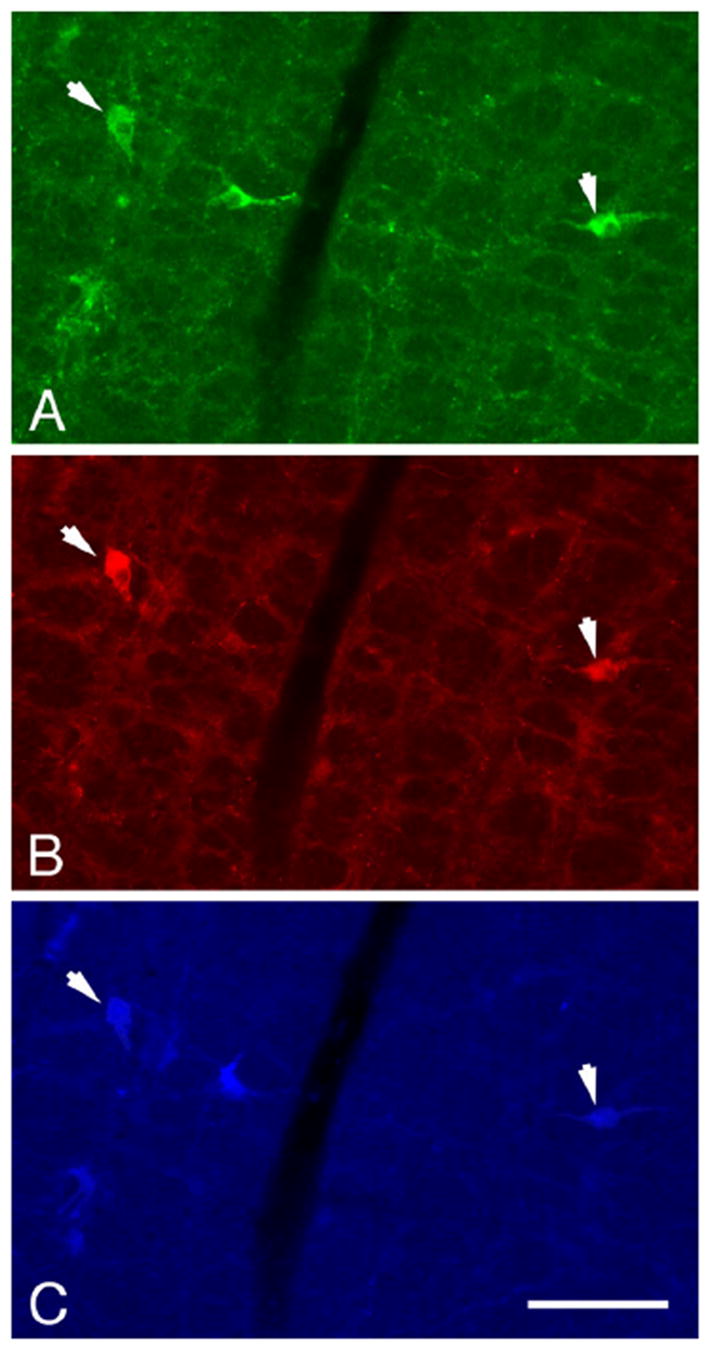
The hypothalamic paraventricular nucleus (PVN) coordinates major neuroendocrine and behavioral mechanisms, particularly responses to homeostatic challenges. Parvocellular and magnocellular PVN neurons are richly innervated by pituitary adenylate cyclase-activating polypeptide (PACAP) axons. Our recent functional observations have also suggested that PACAP may be an excitatory neuropeptide at the level of the PVN. Nevertheless, the exact localization of PACAP-producing neurons that project to the PVN is not understood. The present study examined the specific contribution of various brain areas sending PACAP innervation to the rat PVN by using iontophoretic microinjections of the retrograde neuroanatomical tracer cholera toxin B subunit (CTb). Retrograde transport was evaluated from hypothalamic and brainstem sections by using multiple labeling immunofluorescence for CTb and PACAP. PACAP-containing cell groups were found to be retrogradely labeled from the PVN in the median preoptic nucleus; preoptic and lateral hypothalamic areas; arcuate, dorsomedial, ventromedial, and supramammillary nuclei; ventrolateral midbrain periaqueductal gray; rostral and midlevel ventrolateral medulla, including the C1 catecholamine cell group; nucleus of the solitary tract; and dorsal motor nucleus of vagus. Minor PACAP projections with scattered double-labeled neurons originated from the parabrachial nucleus, pericoeruleus area, and caudal regions of the nucleus of the solitary tract and ventrolateral medulla. These observations indicate a multisite origin of PACAP innervation to the PVN and provide a strong chemical neuroanatomical foundation for interaction between PACAP and its potential target neurons in the PVN, such as parvocellular CRH neurons, controlling physiologic responses to stressful challenges and other neuroendocrine or preautonomic PVN neurons.
(c) 2006 Wiley-Liss, Inc.
Figures
Similar articles
-
Origin of cocaine- and amphetamine-regulated transcript (CART)-immunoreactive innervation of the hypothalamic paraventricular nucleus.J Comp Neurol. 2004 Feb 9;469(3):340-50. doi: 10.1002/cne.10999. J Comp Neurol. 2004. PMID: 14730586
-
Pituitary adenylate cyclase-activating peptide gene expression in corticotropin-releasing factor-containing parvicellular neurons of the rat hypothalamic paraventricular nucleus is induced by colchicine, but not by adrenalectomy, acute osmotic, ether, or restraint stress.Endocrinology. 1995 Sep;136(9):4116-24. doi: 10.1210/endo.136.9.7649120. Endocrinology. 1995. PMID: 7649120
-
Presence of pituitary adenylate cyclase-activating polypeptide (PACAP) defines a subpopulation of hypothalamic POMC neurons.Brain Res. 2007 Dec;1186:203-11. doi: 10.1016/j.brainres.2007.10.015. Epub 2007 Oct 17. Brain Res. 2007. PMID: 18001699
-
Two ancient neuropeptides, PACAP and AVP, modulate motivated behavior at synapses in the extrahypothalamic brain: a study in contrast.Cell Tissue Res. 2019 Jan;375(1):103-122. doi: 10.1007/s00441-018-2958-z. Epub 2018 Dec 5. Cell Tissue Res. 2019. PMID: 30519837 Review.
-
Advent and recent advances in research on the role of pituitary adenylate cyclase-activating polypeptide (PACAP) in the regulation of gonadotropic hormone secretion of female rats.J Mol Neurosci. 2014 Nov;54(3):494-511. doi: 10.1007/s12031-014-0294-7. Epub 2014 Apr 3. J Mol Neurosci. 2014. PMID: 24696167 Review.
Cited by
-
Targeted Pituitary Adenylate Cyclase-Activating Peptide Therapies for Migraine.Neurotherapeutics. 2018 Apr;15(2):371-376. doi: 10.1007/s13311-017-0596-x. Neurotherapeutics. 2018. PMID: 29464574 Free PMC article. Review.
-
Oxytocin as an adolescent treatment for methamphetamine addiction after early life stress in male and female rats.Neuropsychopharmacology. 2022 Jul;47(8):1561-1573. doi: 10.1038/s41386-022-01336-y. Epub 2022 May 17. Neuropsychopharmacology. 2022. PMID: 35581382 Free PMC article.
-
Somatostatin Gene and Protein Expression in the Non-human Primate Central Extended Amygdala.Neuroscience. 2019 Feb 21;400:157-168. doi: 10.1016/j.neuroscience.2018.12.035. Epub 2019 Jan 2. Neuroscience. 2019. PMID: 30610938 Free PMC article.
-
Role of the PACAP system of the extended amygdala in the acoustic startle response in rats.Neuropharmacology. 2019 Dec 1;160:107761. doi: 10.1016/j.neuropharm.2019.107761. Epub 2019 Sep 4. Neuropharmacology. 2019. PMID: 31493466 Free PMC article.
-
Parabrachial nucleus (PBn) pituitary adenylate cyclase activating polypeptide (PACAP) signaling in the amygdala: implication for the sensory and behavioral effects of pain.Neuropharmacology. 2014 Nov;86:38-48. doi: 10.1016/j.neuropharm.2014.06.022. Epub 2014 Jul 3. Neuropharmacology. 2014. PMID: 24998751 Free PMC article.
References
-
- Agarwal A, Halvorson LM, Legradi G. Pituitary adenylate cyclase-activating polypeptide (PACAP) mimics neuroendocrine and behavioral manifestations of stress: evidence for PKA-mediated expression of the corticotropin-releasing hormone (CRH) gene. Brain Res Mol Brain Res. 2005;138:45–57. - PMC - PubMed
-
- Arimura A. Perspectives on pituitary adenylate cyclase activating polypeptide (PACAP) in the neuroendocrine, endocrine, and nervous systems. Jpn J Physiol. 1998;48:301–331. - PubMed
-
- Arimura A, Somogyvari-Vigh A, Miyata A, Mizuno K, Coy DH, Kitada C. Tissue distribution of PACAP as determined by RIA: highly abundant in the rat brain and testes. Endocrinology. 1991;129:2787–2789. - PubMed
-
- Bandler R, Shipley MT. Columnar organization in the midbrain periaqueductal gray: modules for emotional expression? Trends Neurosci. 1994;17:379–389. - PubMed
Publication types
MeSH terms
Substances
Grants and funding
LinkOut - more resources
Full Text Sources
