

Augmented designs to assess immune response in vaccine trials
- PMID: 17156291
- PMCID: PMC2536776
- DOI: 10.1111/j.1541-0420.2006.00569.x
Augmented designs to assess immune response in vaccine trials
Abstract
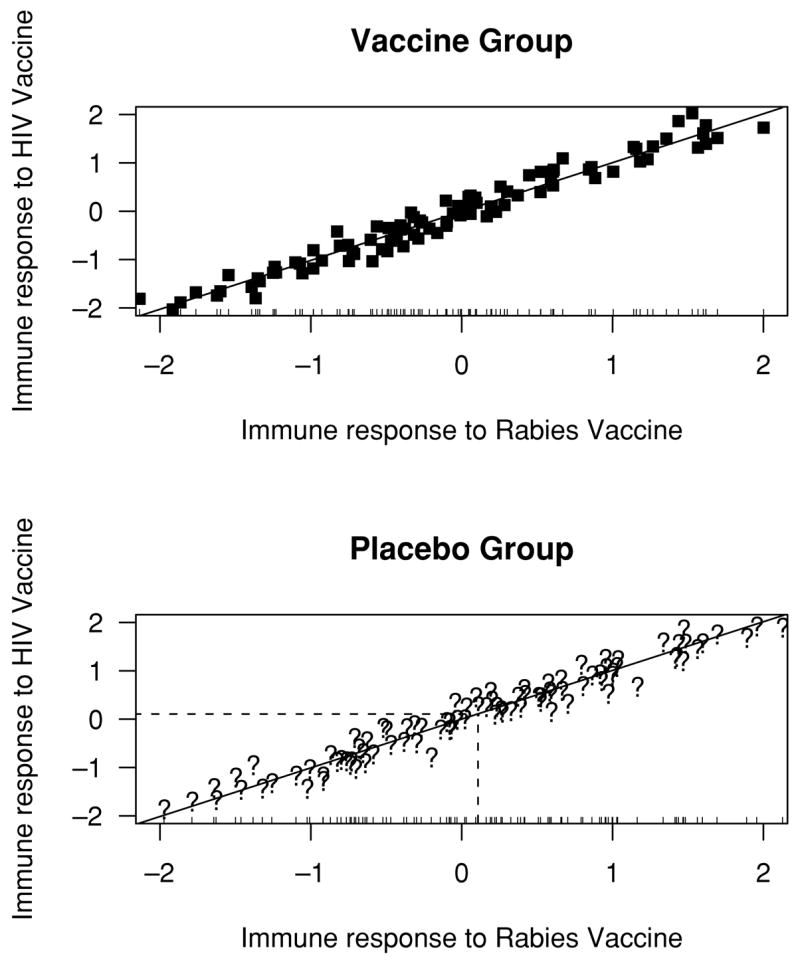
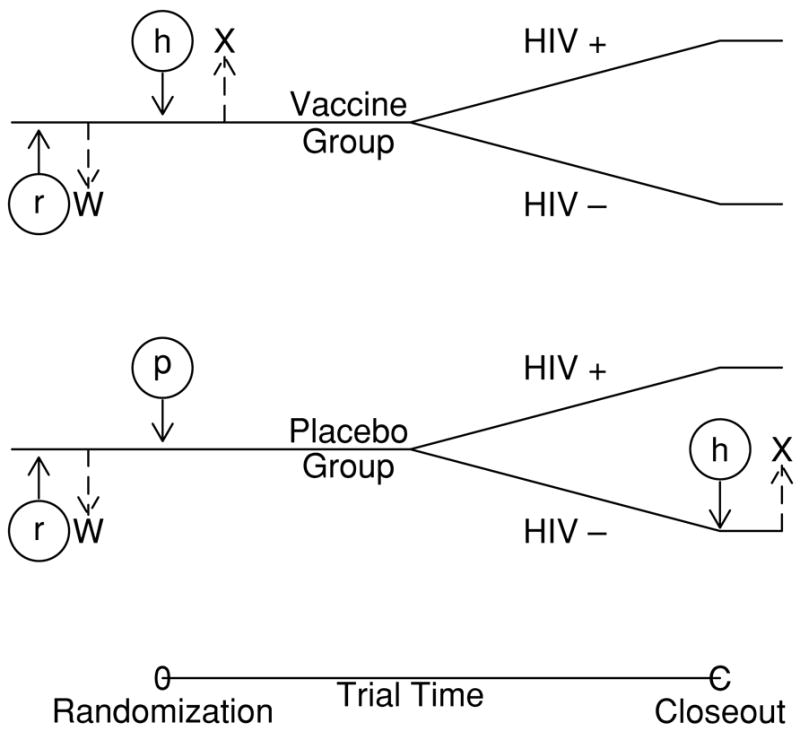
This article introduces methods for use in vaccine clinical trials to help determine whether the immune response to a vaccine is actually causing a reduction in the infection rate. This is not easy because immune response to the (say HIV) vaccine is only observed in the HIV vaccine arm. If we knew what the HIV-specific immune response in placebo recipients would have been, had they been vaccinated, this immune response could be treated essentially like a baseline covariate and an interaction with treatment could be evaluated. Relatedly, the rate of infection by this baseline covariate could be compared between the two groups and a causative role of immune response would be supported if infection risk decreased with increasing HIV immune response only in the vaccine group. We introduce two methods for inferring this HIV-specific immune response. The first involves vaccinating everyone before baseline with an irrelevant vaccine, for example, rabies. Randomization ensures that the relationship between the immune responses to the rabies and HIV vaccines observed in the vaccine group is the same as what would have been seen in the placebo group. We infer a placebo volunteer's response to the HIV vaccine using their rabies response and a prediction model from the vaccine group. The second method entails vaccinating all uninfected placebo patients at the closeout of the trial with the HIV vaccine and recording immune response. We pretend this immune response at closeout is what they would have had at baseline. We can then infer what the distribution of immune response among placebo infecteds would have been. Such designs may help elucidate the role of immune response in preventing infections. More pointedly, they could be helpful in the decision to improve or abandon an HIV vaccine with mediocre performance in a phase III trial.
Figures
References
-
- Carey VJ, Baker CJ, Platt R. Bayesian inference on protective antibody levels using case-control data. Biometrics. 2001;57:135–142. - PubMed
-
- Chan I, Li S, Matthews H, Chan C, Vessey R, Sadoff J, Heyse J. Use of statistical models for evaluating antibody response as a correlate of protection against varicella. Statistics in Medicine. 2002;21:3411–3430. - PubMed
-
- Chan I, Wang W, Heyse J. Vaccine clinical trials. In: Chow S-C, editor. Encyclopedia of Biopharmaceutical Statistics. 2. New York: Marcel Dekker; 2003. pp. 1005–1022.
-
- Follmann D. On the effect of treatment among treatment compliers: An analysis of the Multiple Risk Factor Intervention Trial. Journal of the American Statistical Association. 2000;95:1101–1109.
MeSH terms
Substances
Grants and funding
LinkOut - more resources
Full Text Sources
Medical
