

Preparative reversed-phase high-performance liquid chromatography collection efficiency for an antimicrobial peptide on columns of varying diameters (1mm to 9.4mm I.D.)
- PMID: 17156789
- PMCID: PMC2759115
- DOI: 10.1016/j.chroma.2006.11.052
Preparative reversed-phase high-performance liquid chromatography collection efficiency for an antimicrobial peptide on columns of varying diameters (1mm to 9.4mm I.D.)
Abstract
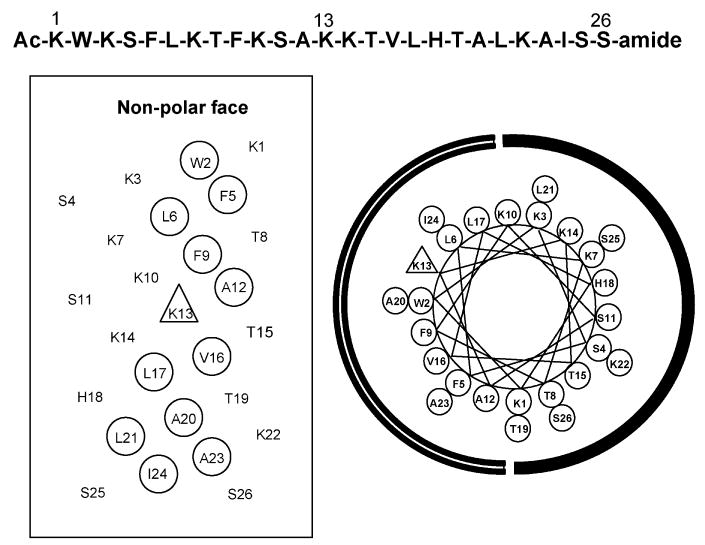
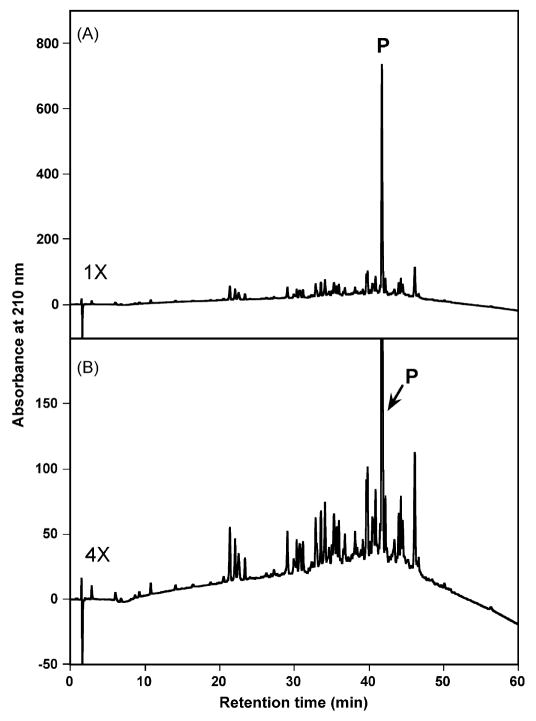
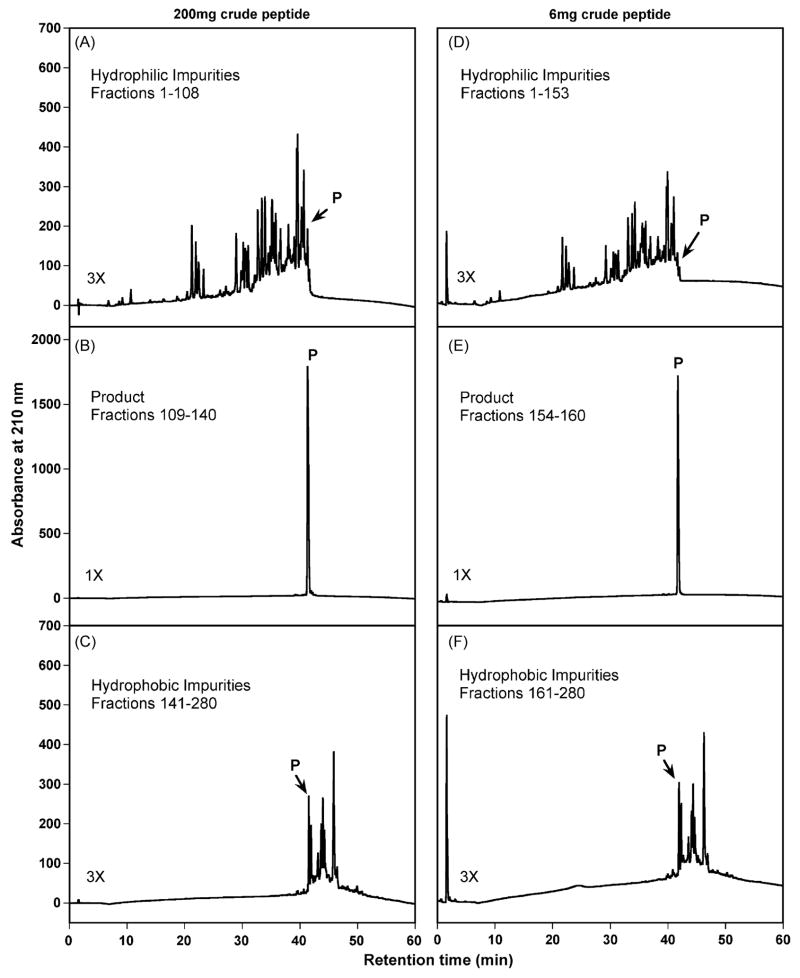
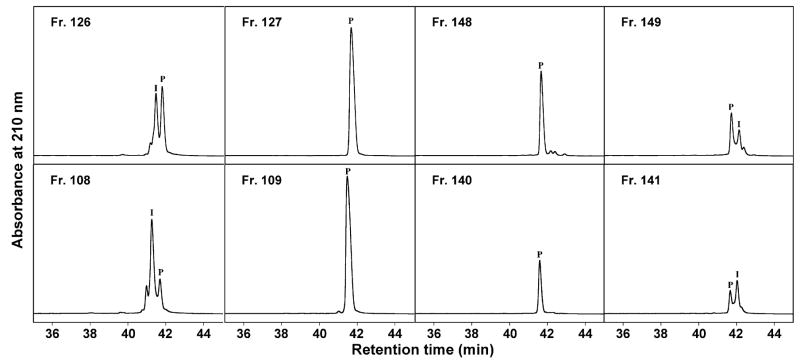
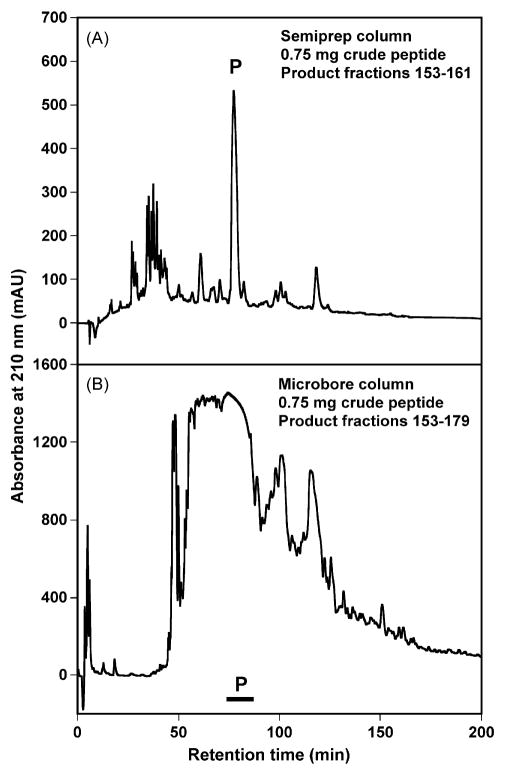
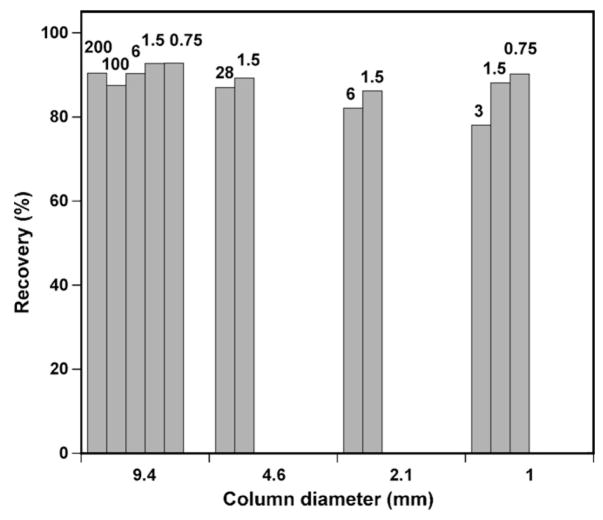
The present study examines the effect of reversed-phase high-performance liquid chromatography (RP-HPLC) column diameter (1mm to 9.4mm I.D.) on the one-step slow gradient preparative purification of a 26-residue synthetic antimicrobial peptide. When taken together, the semi-preparative column (9.4mm I.D.) provided the highest yields of purified product (an average of 90.7% recovery from hydrophilic and hydrophobic impurities) over a wide range of sample load (0.75-200mg). Columns with smaller diameters, such as narrowbore columns (150x2.1mm I.D.) and microbore columns (150x1.0mm I.D.), can be employed to purify peptides with reasonable recovery of purified product but the range of the crude peptide that can be applied to the column is limited. In addition, the smaller diameter columns require more extensive fraction analysis to locate the fractions of pure product than the larger diameter column with the same load. Our results show the excellent potential of the one-step slow gradient preparative protocol as a universal method for purification of synthetic peptides.
Figures
Similar articles
-
Preparative reversed-phase liquid chromatography of peptides. Isocratic two-step elution system for high loads on analytical columns.J Chromatogr A. 2002 Sep 27;972(1):87-99. doi: 10.1016/s0021-9673(02)01076-2. J Chromatogr A. 2002. PMID: 12395949
-
HPLC analysis and purification of peptides.Methods Mol Biol. 2007;386:3-55. doi: 10.1007/978-1-59745-430-8_1. Methods Mol Biol. 2007. PMID: 18604941 Free PMC article.
-
Development of simultaneous purification methodology for multiple synthetic peptides by reversed-phase sample displacement chromatography.J Chromatogr A. 2000 Sep 29;893(1):81-94. doi: 10.1016/s0021-9673(00)00751-2. J Chromatogr A. 2000. PMID: 11043589
-
Column Characterization and Selection Systems in Reversed-Phase High-Performance Liquid Chromatography.Chem Rev. 2019 Mar 27;119(6):3674-3729. doi: 10.1021/acs.chemrev.8b00246. Epub 2019 Jan 3. Chem Rev. 2019. PMID: 30604951 Review.
-
Micropreparative high-performance liquid chromatography of proteins and peptides.J Pharm Biomed Anal. 1989;7(9):1039-53. doi: 10.1016/0731-7085(89)80043-3. J Pharm Biomed Anal. 1989. PMID: 2490112 Review.
Cited by
-
Insights into the antibacterial mechanism of PEGylated nano-bacitracin A against Streptococcus pneumonia: both penicillin-sensitive and penicillin-resistant strains.Int J Nanomedicine. 2018 Oct 10;13:6297-6309. doi: 10.2147/IJN.S178596. eCollection 2018. Int J Nanomedicine. 2018. PMID: 30349251 Free PMC article.
-
A D-peptide analog of the second extracellular loop of claudin-3 and -4 leads to mislocalized claudin and cellular apoptosis in mammary epithelial cells.Chem Biol Drug Des. 2011 Feb;77(2):124-36. doi: 10.1111/j.1747-0285.2010.01061.x. Chem Biol Drug Des. 2011. PMID: 21266016 Free PMC article.
-
Role of peptide hydrophobicity in the mechanism of action of alpha-helical antimicrobial peptides.Antimicrob Agents Chemother. 2007 Apr;51(4):1398-406. doi: 10.1128/AAC.00925-06. Epub 2006 Dec 11. Antimicrob Agents Chemother. 2007. PMID: 17158938 Free PMC article.
-
Critical interactions in the stability control region of tropomyosin.J Struct Biol. 2010 May;170(2):294-306. doi: 10.1016/j.jsb.2010.01.020. Epub 2010 Feb 6. J Struct Biol. 2010. PMID: 20144718 Free PMC article.
-
Structure-guided RP-HPLC chromatography of diastereomeric α-helical peptide analogs substituted with single amino acid stereoisomers.Biomed Chromatogr. 2014 Apr;28(4):511-7. doi: 10.1002/bmc.3061. Epub 2013 Oct 11. Biomed Chromatogr. 2014. PMID: 24127254 Free PMC article.
References
-
- Mant CT, Hodges RS, editors. HPLC of Peptides and Proteins: Separation, Analysis and Conformation. CRC Press; Boca Raton, FL: 1991.
-
- Mant CT, Kondejewski LH, Cachia PJ, Monera OD, Hodges RS. Methods Enzymol. 1997;289:426. - PubMed
-
- Cunico RL, Gooding KM, Wehr T, editors. HPLC and CE of Biomolecules. Bay Bioanalytical Laboratory; Richmond: 1998.
-
- Mant CT, Hodges RS. In: HPLC of Biological Macromolecules. Gooding KM, Regnier FE, editors. Marcel Dekker; New York: 2002. p. 433.
-
- Mant CT, Burke TWL, Hodges RS. Chromatographia. 1987;24:565.
Publication types
MeSH terms
Substances
Grants and funding
LinkOut - more resources
Full Text Sources
Other Literature Sources
