. 2007 Apr 10;360(2):364-75.
doi: 10.1016/j.virol.2006.10.044. Epub 2006 Dec 6.

Murine coronavirus-induced oligodendrocyte apoptosis is mediated through the activation of the Fas signaling pathway

Affiliations

Murine coronavirus-induced oligodendrocyte apoptosis is mediated through the activation of the Fas signaling pathway

Yin Liu et al. Virology. .

Abstract

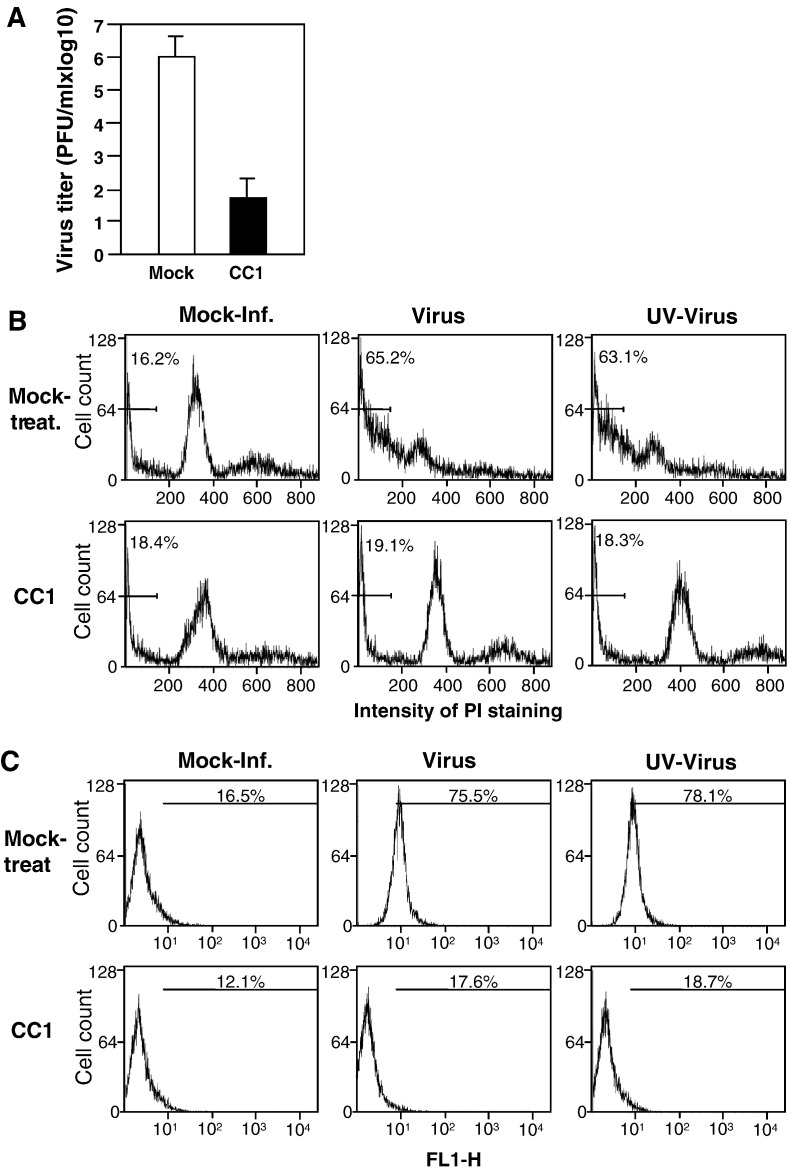
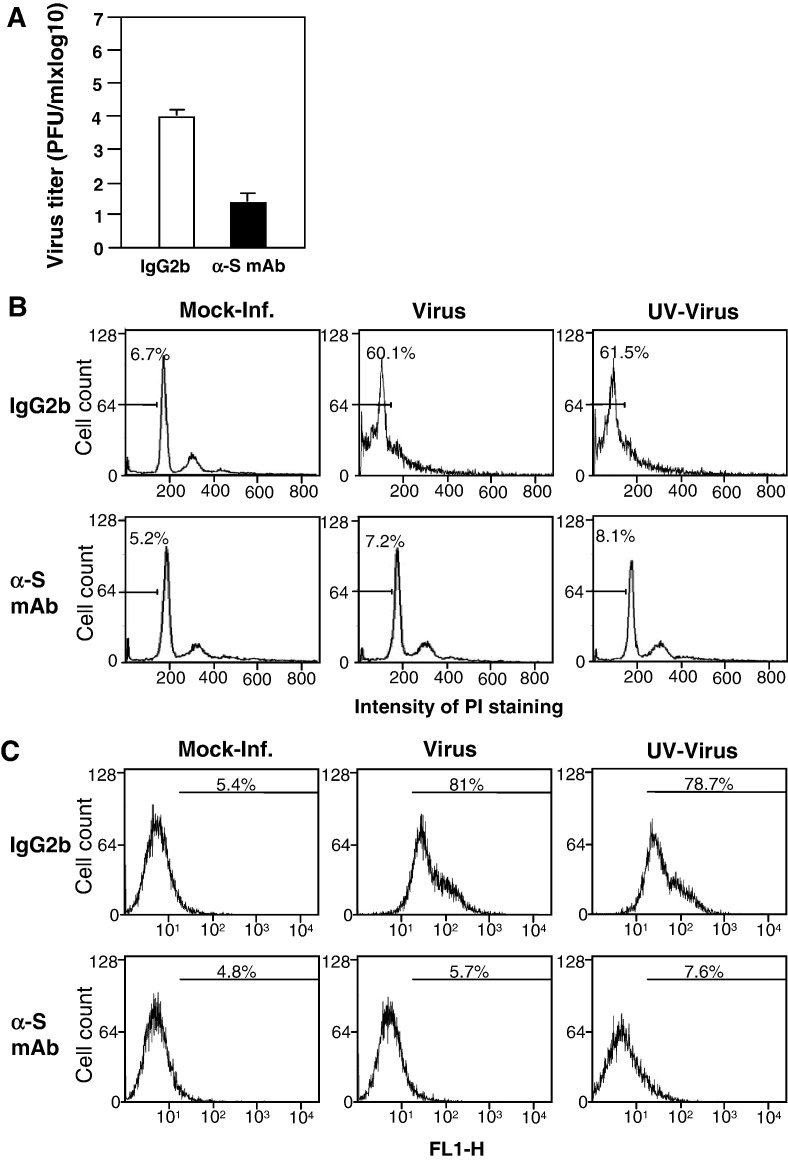
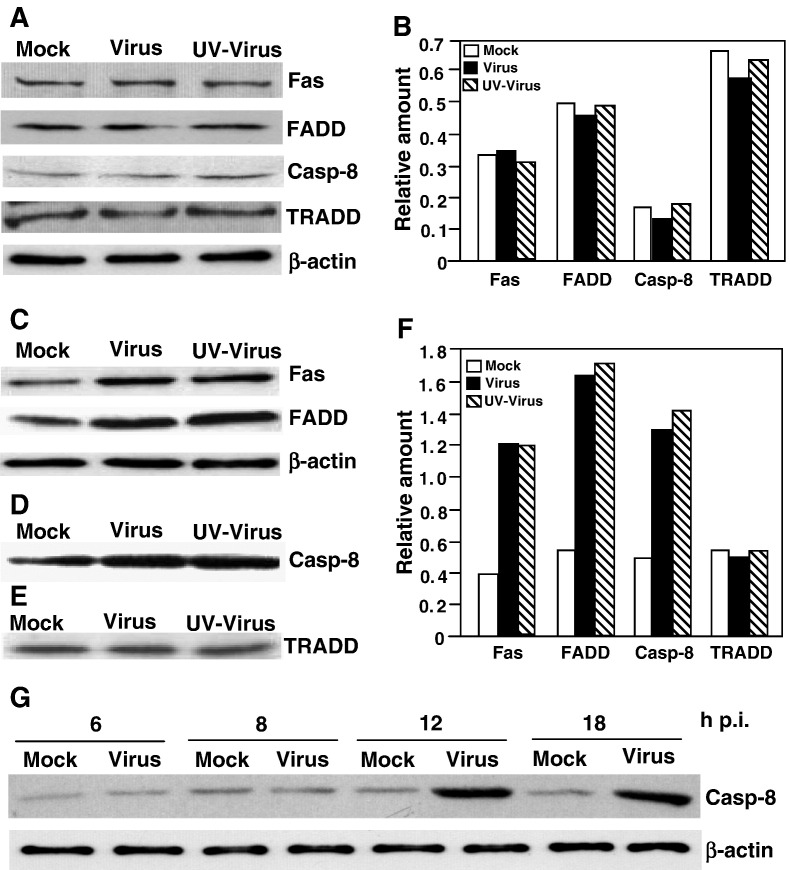
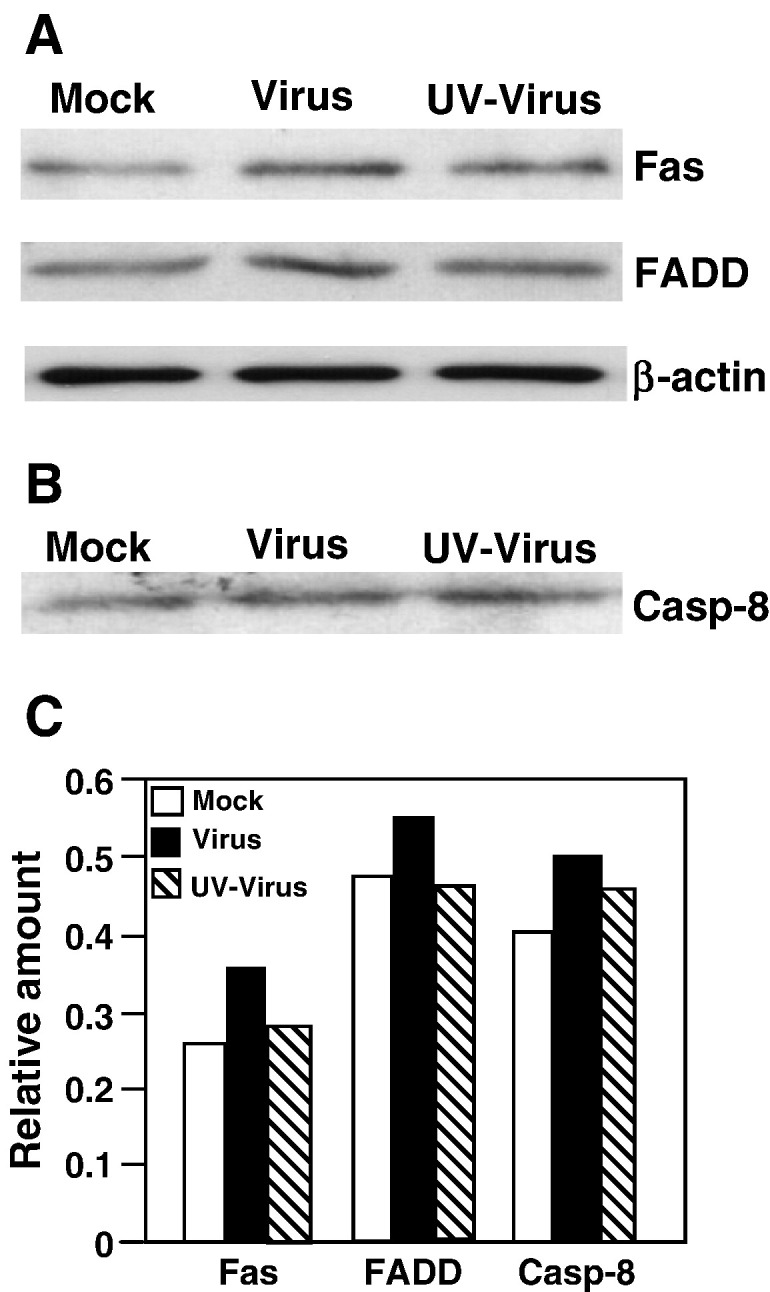
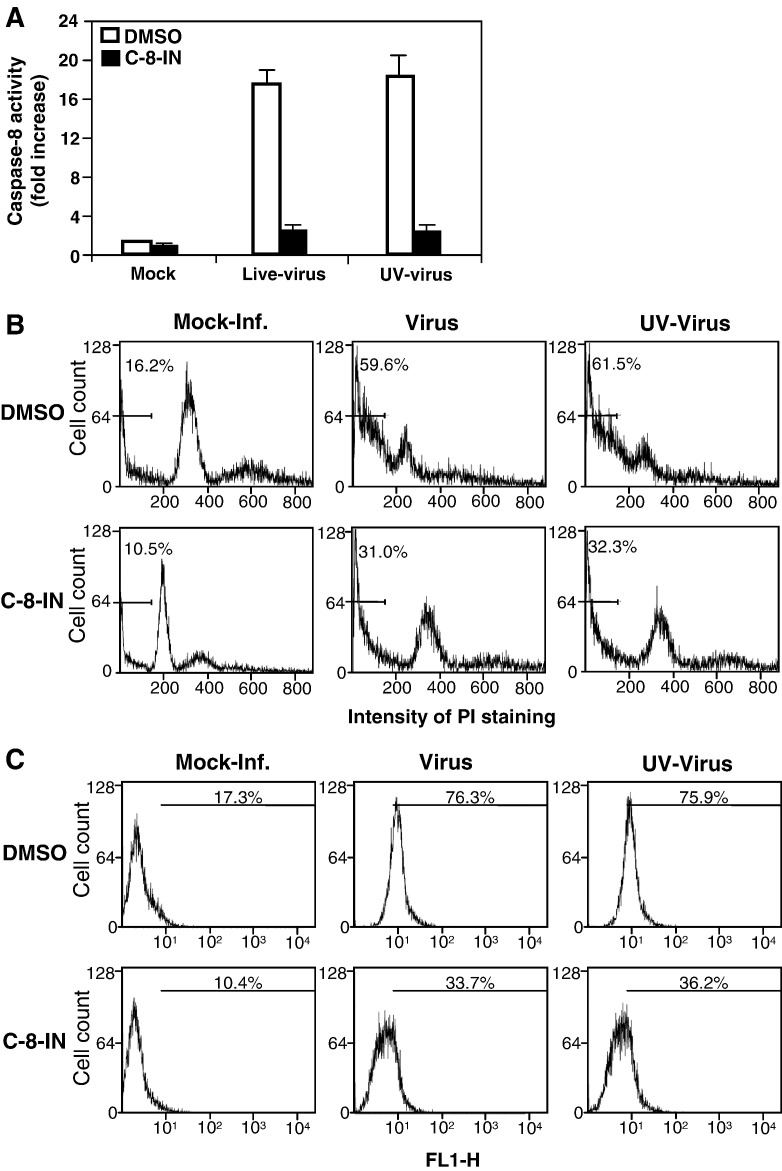
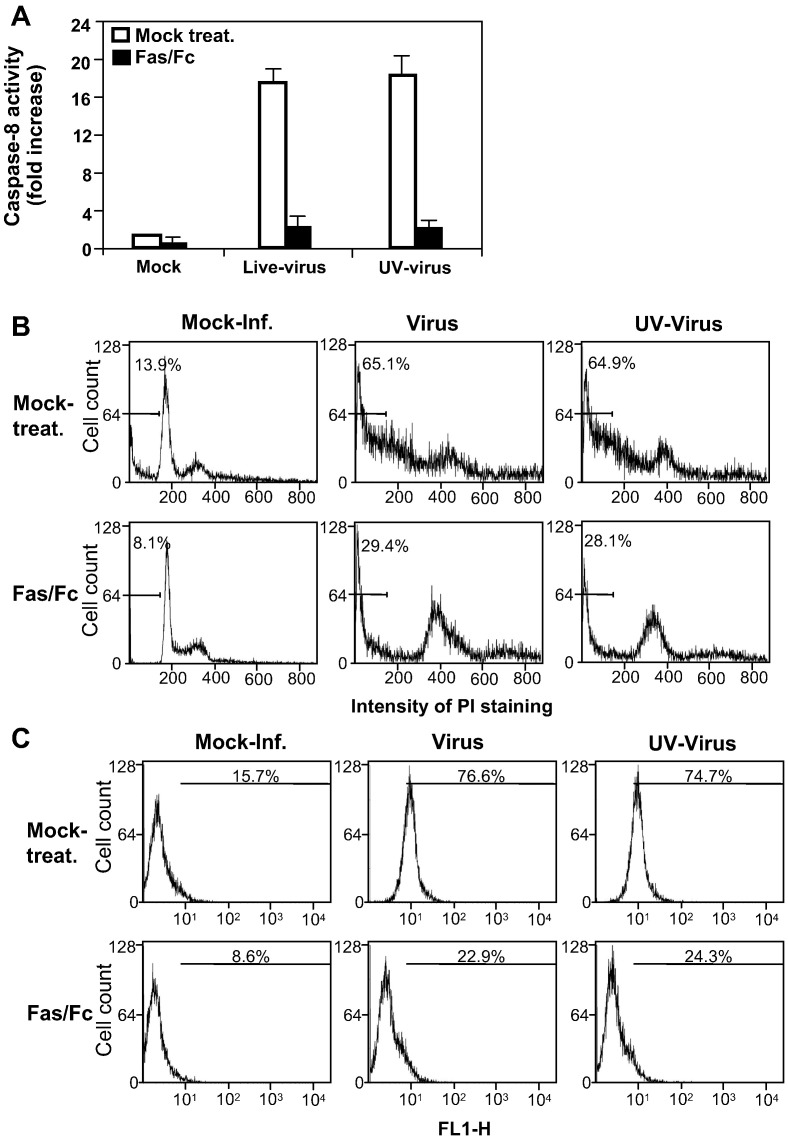
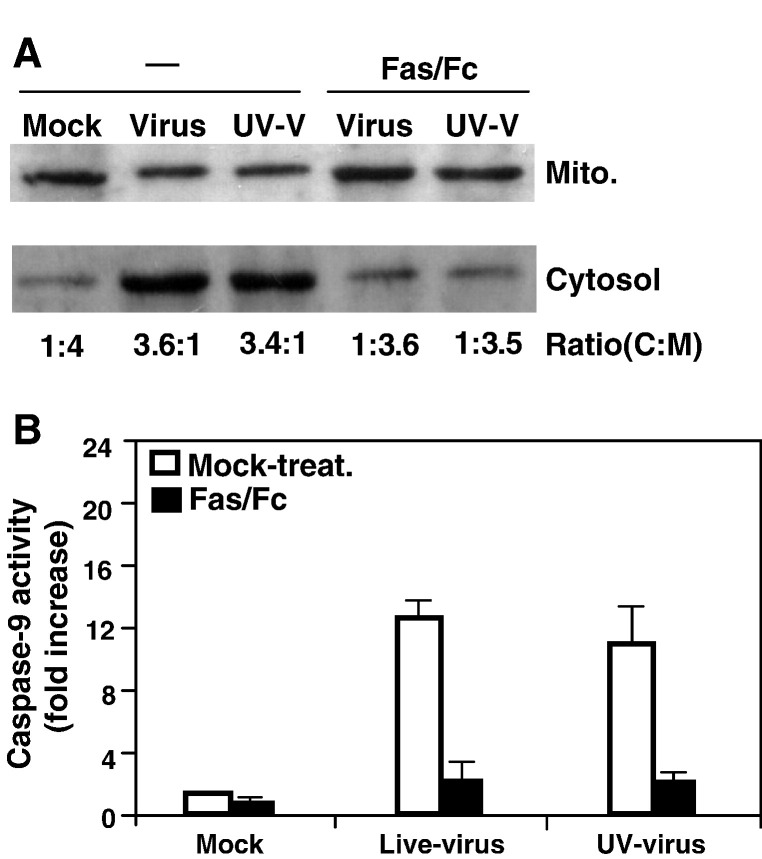
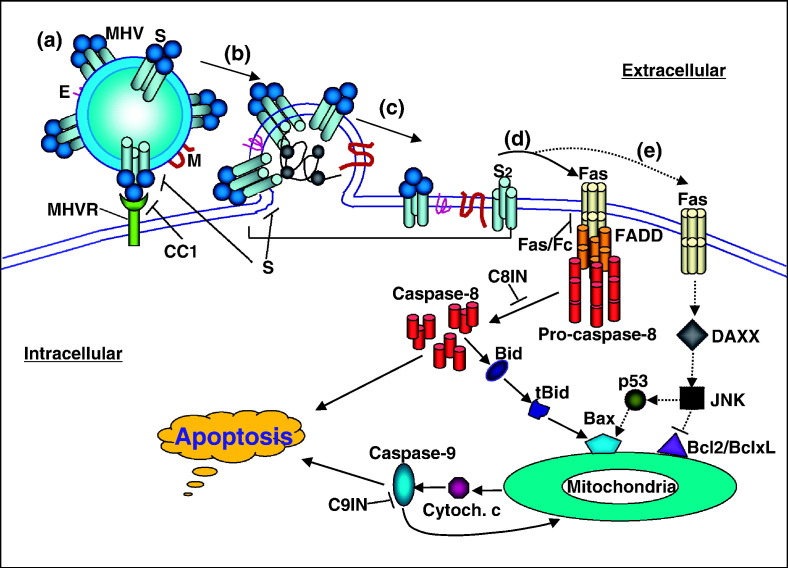
We previously showed that infection of rat oligodendrocytes by ultraviolet light-inactivated mouse hepatitis virus (MHV) resulted in apoptosis, suggesting that the apoptosis is triggered during cell entry. To further characterize the earliest apoptotic signaling events, here we treated cells with an antibody specific to the MHV receptor prior to and during virus infection or with an antibody specific to MHV spike protein following virus binding. Both treatments blocked virus infection and apoptosis, indicating that virus-receptor binding is necessary but not sufficient for the apoptosis induction. Furthermore, virus infection significantly increased the formation of the "death-receptor complexes" consisting of Fas, Fas-associated death domain and procaspase-8, but did not induce the complexes involving the tumor necrosis factor receptor and its associated death domain, demonstrating the specific activation of the Fas signaling pathway. Moreover, virus infection did not alter the abundance of the individual proteins of the complexes, suggesting that the activation of the Fas signaling pathway was at the post-translational level. Treatment with a Fas/Fc chimera, which blocks Fas-Fas ligand-mediated apoptosis, inhibited the formation of the complexes and blocked the activation of caspase-8 and apoptosis in MHV-infected cells. It also inhibited the release of cytochrome c from mitochondria and the activation of caspase-9. These results demonstrate that oligodendrocyte apoptosis is triggered by MHV infection during cell entry through the activation of the Fas signaling pathway.


Figures

Fig. 1
Fig. 1
Inhibition of MHV-induced oligodendrocyte apoptosis by treatment of cells with a neutralizing anti-MHV receptor antibody. (A) Effect of the MHV receptor antibody on virus infection. Cells were mock-treated or treated with the anti-MHV receptor antibody CC1 at 37 °C for 30 min and were infected with MHV in the presence of the CC1 antibody for 1 h. Virus titers were determined at 24 h p.i. by plaque assay and were expressed as means ± SD from three independent experiments. (B) Analysis of apoptosis by propidium iodide (PI) staining. Cells were either treated with the CC1 antibody or mock-treated as described for panel A and were infected with live- or UV-inactivated MHV. At 48 h p.i., cells were stained with PI and subjected to flow cytometric analysis. The bar in each graph represents the sub-G0/G1 population of cells (indicated as a percentage) that have the lowest intensity of PI staining. Data are representative of at least three independent experiments. (C) Analysis of apoptosis by detecting annexin V binding. The experiments were performed as in panel B, except that the detection of annexin V binding on the cell surface was carried out at 12 h p.i. with the annexin V-EGFP assay kit. Annexin V-positive cells was quantified by flow cytometry and indicated as percentage in each graph. For statistical analysis, data from three independent experiments were analyzed and compared with the mock controls. FL1-H, fluorescence intensity.
Fig. 2
Fig. 2
Inhibition of MHV-induced oligodendrocyte apoptosis by treatment with a neutralizing antibody against the MHV spike protein. The experiments were carried out essentially the same as described in the legend of Fig. 1, except the initial treatment with the antibody as noted below. Cells were mock-infected or infected with live- or UV-inactivated MHV at 4 °C for 1 h. Virus-bound cells were washed with cold PBS twice and the neutralizing monoclonal antibody specific to the spike protein of MHV, termed J2.6, or IgG2b (as isotype control) was added to the culture and incubated at 4 °C for another hour. The culture was then incubated at 37 °C for 1 h to allow virus entry. Virus titers were determined only for live virus-infected culture at 24 h p.i. and were expressed as means ± SD from three independent experiments (A). Apoptosis was analyzed with PI staining at 48 h p.i. (B) or by detecting annexin V binding at 12 h p.i. (C) as described in the legend of Fig. 1.
Fig. 3
Fig. 3
Induction of death receptor complex formation by MHV infection. (A) Western blot analysis of protein abundance. Cells were infected with live (Virus)- or UV-inactivated MHV (UV virus) at an m.o.i. of 10 or mock-infected (Mock). At 24 h p.i., cells were lysed and an equivalent amount of proteins in each sample was analyzed by Western blot using antibodies specific to the individual proteins as indicated at the right of the panel. β-Actin was used as an internal control. (B) Quantification of the protein bands shown in panel A. The intensity of each band was determined by densitometry and was expressed as relative amount to the β-actin control in each lane, which was set as 1-fold. (C) Detection of complex formation by co-immunoprecipitation and Western blot. Cells were infected and lysed as described in panel A. Cell lysates were used for precipitation with an antibody specific to caspase-8. The immunocomplexes were resolved by SDS–PAGE and analyzed by Western blot with an antibody specific to the individual proteins as indicated at the right of the panel. Note that the lysates for each sample used in the immunoprecipitation were approximately 24 times more than those used in the Western blot analysis shown in panel A. (D) The experiment was performed as in panel C, except that the anti-FADD antibody was used for immunoprecipitation and the anti-caspase-8 antibody for Western blot. (E) The experiment was performed as in panel C using the same anti-caspase-8 antibody for immunoprecipitation except that the anti-TRADD antibody was used for Western blot analysis. (F) Quantification of the protein bands shown in panels C, D and E as described in panel B. (G) Kinetics of the complex formation in virus-infected and mock-infected cells. The complexes were precipitated by an antibody specific to FADD and were detected by the presence of caspase-8 with an antibody specific to caspase-8 in Western blot analysis. β-Actin was used as a control for protein loading.
Fig. 4
Fig. 4
Inhibition of death receptor complex formation by the Fas/Fc chimera. (A and B) Cells were treated with the Fas/Fc chimera 1 h prior to and during virus infection. Cells were infected with live (Virus)- or UV-inactivated virus (UV virus) or mock-infected (Mock). Cell lysates were subjected to immunoprecipitation with an antibody to caspase-8 (A) or to FADD (B). The immunocomplexes were resolved by SDS–PAGE and analyzed by Western blot with an antibody specific to the individual proteins shown on the right of the panels. β-Actin was used as a control for protein loading. (C) Quantification of the protein bands shown in panels A and B. The intensity of each band was determined by densitometry and was expressed as relative amount to the β-actin control in each lane, which was set as 1-fold.
Fig. 5
Fig. 5
Activation of caspase-8 and apoptosis in oligodendrocytes by MHV infection. (A) Caspase-8 activity. Cells were infected with live- or UV-inactivated MHV at an m.o.i. of 10 or mock-infected (mock) and were either mock-treated (DMSO) or treated with caspase-8 inhibitor (C-8-IN). At 24 h p.i., caspase-8 activity in the cell lysates was detected with a caspase colorimetric protease assay kit using specific substrates as described in Materials and methods. The caspase-8 activity from virus-infected cells was expressed as means ± SD from three independent experiments and as fold increase over that from mock-infected control, which was set as 1-fold. (B) Analysis of apoptosis by PI staining. Cells were infected and treated as described in panel A. At 48 h p.i., cells were stained with PI and subjected to flow cytometric analysis. The bar in each graph represents the sub-G0/G1 population of cells (indicated as a percentage) that have the lowest intensity of PI staining. Data are representative of at least three independent experiments. (C) Analysis of apoptosis by detecting annexin V binding. The experiments were performed as in panels A and B, except that the detection of annexin V binding on the cell surface was carried out at 12 h p.i. with the annexin V-EGFP assay kit. Annexin V-positive cells were quantified by flow cytometry and indicated as percentage in each graph. For statistical analysis, data from three independent experiments were analyzed and compared to those of the controls (mock-treated or mock-infected). FL1-H, fluorescence intensity.
Fig. 6
Fig. 6
Inhibition of caspase-8 activity and apoptosis by the Fas/Fc chimera. The experiments were performed exactly as described in the legend of Fig. 5, except that the cells were treated with Fas/Fc chimera instead of the caspase-8 inhibitor.
Fig. 7
Fig. 7
Effect of Fas/Fc treatment on the release of cytochrome c from mitochondria during MHV infection. (A) Cells were infected with live-virus (Virus) or UV-inactivated virus (UV-V) or mock-infected (Mock) and were either untreated (−) or treated with the Fas/Fc chimera. At 24 h p.i., cells were harvested and the cytosolic (cytosol.) and mitochondrial (mito.) fractions were separated by differential centrifugation using cytochrome c release assay kit as described in Materials and methods. Proteins were separated by SDS–PAGE (10% gel), transferred to nitrocellulose membranes and detected by Western blot analysis. Cytochrome c was detected in Western blot with a cytochrome c-specific antibody included in the kit. The amount of each protein band was quantified by densitometric analysis with the UPV software. The efficiency of release of cytochrome c from mitochondrial fraction into cytosolic fraction was expressed as a ratio of cytochrome c in the cytosolic fraction to mitochondrial fraction (C:M) shown at the bottom of the panel. (B) Inhibition of caspase-9 activity by the Fas/Fc chimera. Cells were infected with MHV and treated with the Fas/Fc chimera as described in panel A. At 12 h p.i., caspase-9 activity in the cell lysates was detected with a caspase colorimetric protease assay kit using specific substrates as described in Materials and methods. The caspase-9 activity from virus-infected cells was expressed as means ± SD from three independent experiments and as fold increase over that from mock-infected control, which was set as 1-fold.
Fig. 8
Fig. 8
Proposed model for the activation of oligodendrocyte apoptosis by MHV infection. (a) Interaction between the viral S protein and MHV receptor (MHVR). (b) Fusion between viral envelope and cell membrane. (c) Integration of viral envelope proteins (E, M, S, S2) into the cell membrane after fusion. (d) Activation of the Fas signal pathway by virus–cell fusion and the post-fusion complexes. This is likely the major pathway leading to activation of the caspase-8 and mitochondrial apoptotic pathways. (e) An alternative pathway of the activation of the Fas signaling. Solid lines with arrows indicate the steps (pathways) that are supported by experimental data, whereas dashed lines with arrows denote the hypothetic pathways with little or no experimental data. The following blocking reagents were used in the experiments to establish the individual steps of the pathways: the CC1 (anti-MHVR antibody), αS (anti-S protein antibody), Fas/Fc (chimeric soluble receptor), C8IN (caspase-8 inhibitor), C9IN (caspase-9 inhibitor) and Bcl-2 or Bcl-xL.

Similar articles

Cited by

References

    1. Barac-Latas V., Suchanek G., Breitschopf H., Stuehler A., Wege H., Lassmann H. Patterns of oligodendrocyte pathology in coronavirus-induced subacute demyelinating encephalomyelitis in the Lewis rat. Glia. 1997;19:1–12. - PubMed
    1. Cheng J., Zhou T., Liu C., Shapiro J.P., Brauer M.J., Kiefer M.C., Barr P.J., Mountz J.D. Protection from Fas-mediated apoptosis by a soluble form of the Fas molecule. Science. 1994;263:1759–1762. - PubMed
    1. Cohen G.M. Caspases: the executioners of apoptosis. Biochem. J. 1997;326:1–16. - PMC - PubMed
    1. Dandekar A.A., Perlman S. Virus-induced demyelination in nude mice is mediated by gamma delta T cells. Am. J. Pathol. 2002;161:1255–1263. - PMC - PubMed
    1. Dveksler G.S., Pensiero M.N., Cardellichio C.B., Williams R.K., Jiang G.S., Holmes K.V., Dieffenbach C.W. Cloning of the mouse hepatitis virus (MHV) receptor: expression in human and hamster cell lines confers susceptibility to MHV. J. Virol. 1991;65:6881–6891. - PMC - PubMed

Publication types

MeSH terms