

Repeated whiskey binges promote liver injury in rats fed a choline-deficient diet
- PMID: 17156887
- PMCID: PMC2562542
- DOI: 10.1016/j.jhep.2006.09.010
Repeated whiskey binges promote liver injury in rats fed a choline-deficient diet
Abstract
Background/aims: Alcoholic liver disease is associated with nutritional deficiency and it may aggravate within the context of fatty liver. We investigated the relationship between alcohol intake (whiskey binge drinking) and a choline-deficient diet (CD) and assessed whether stellate cells could contribute to liver injury in this model.
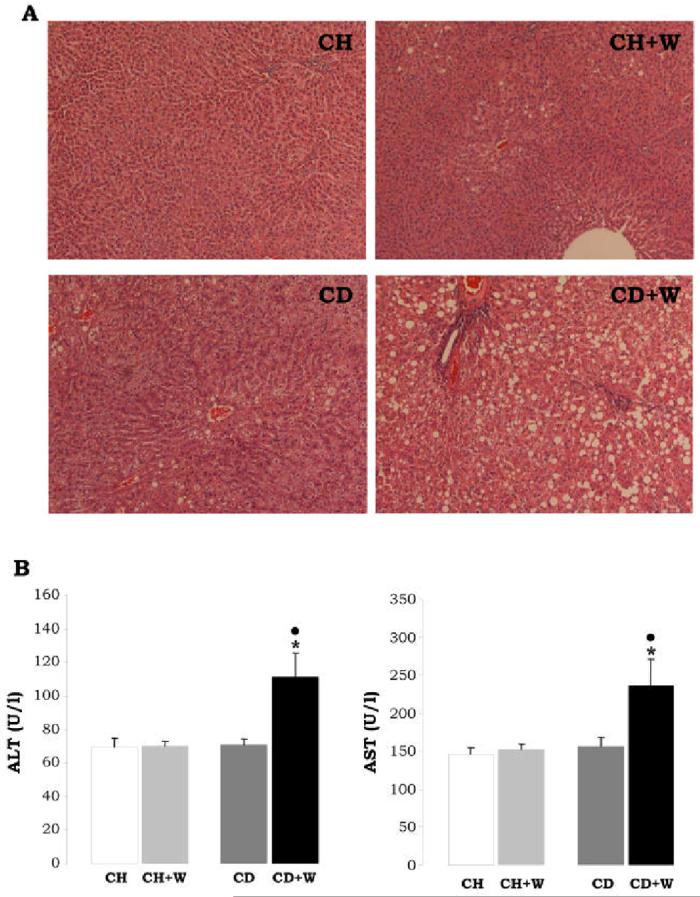
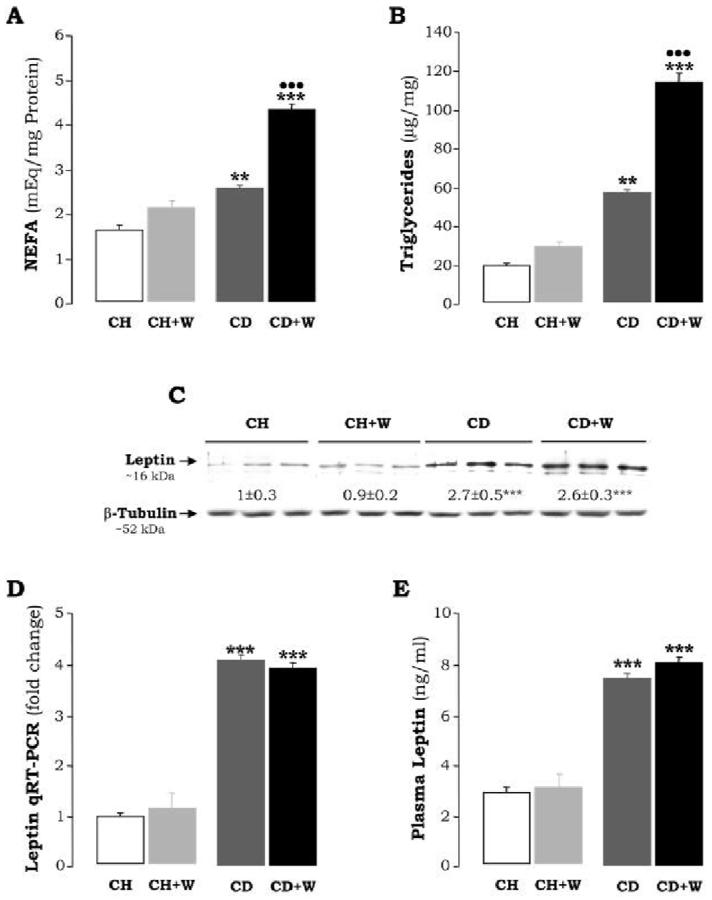
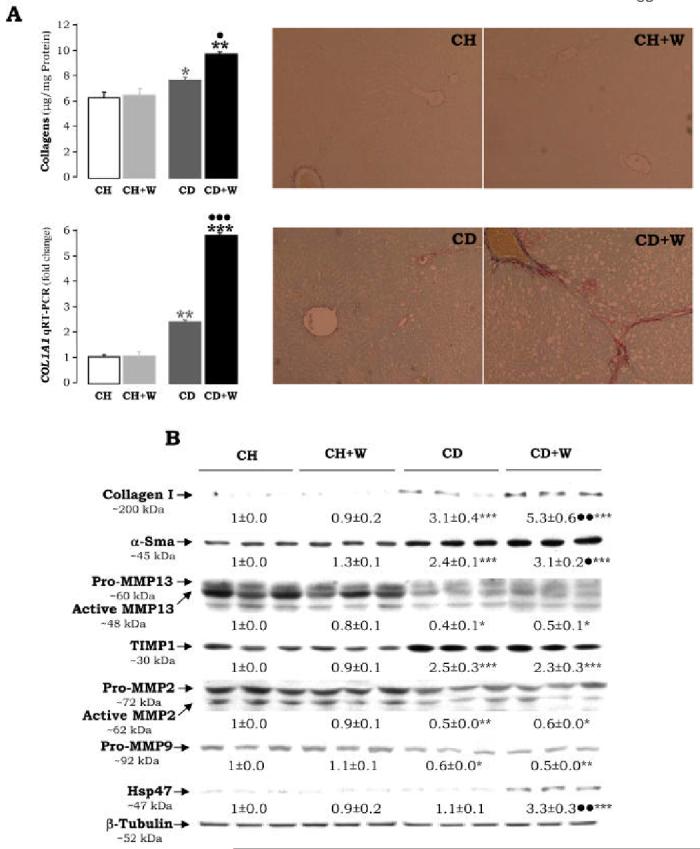
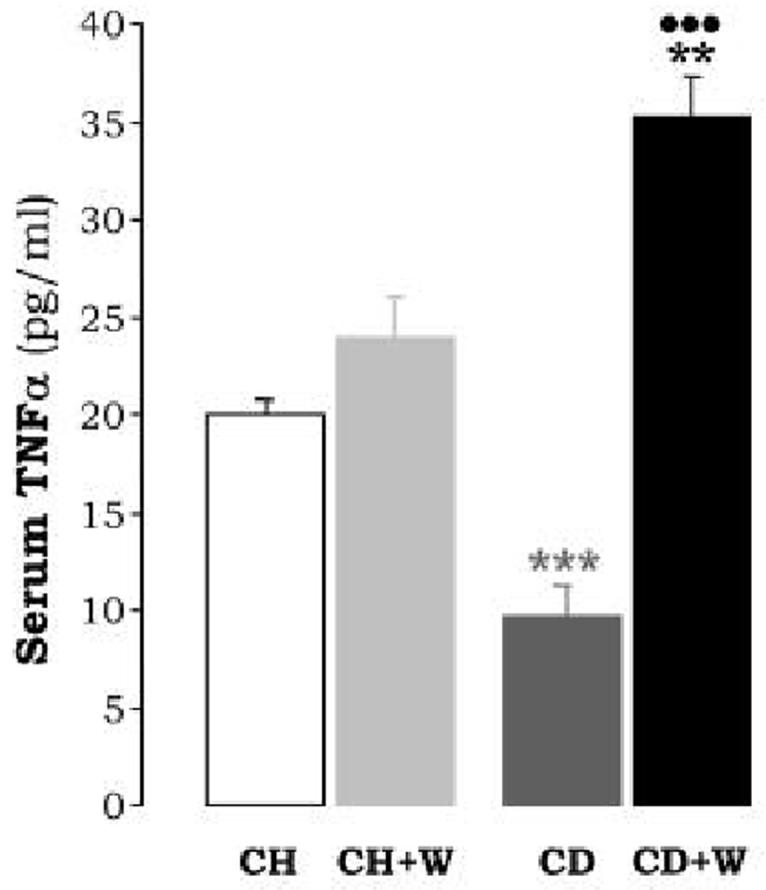
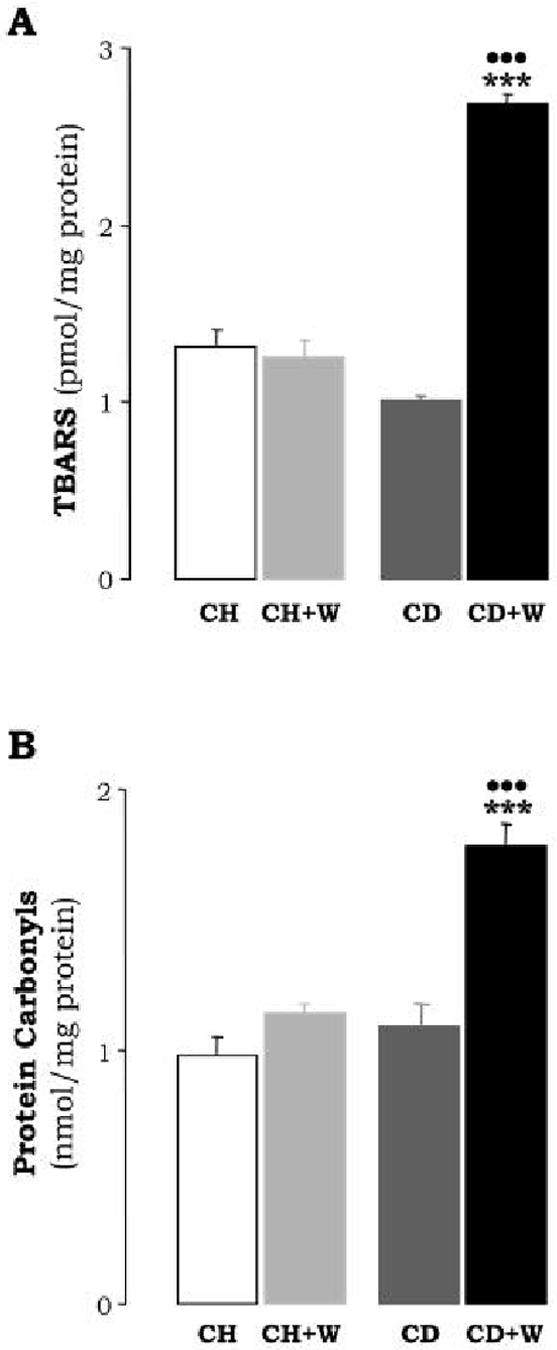
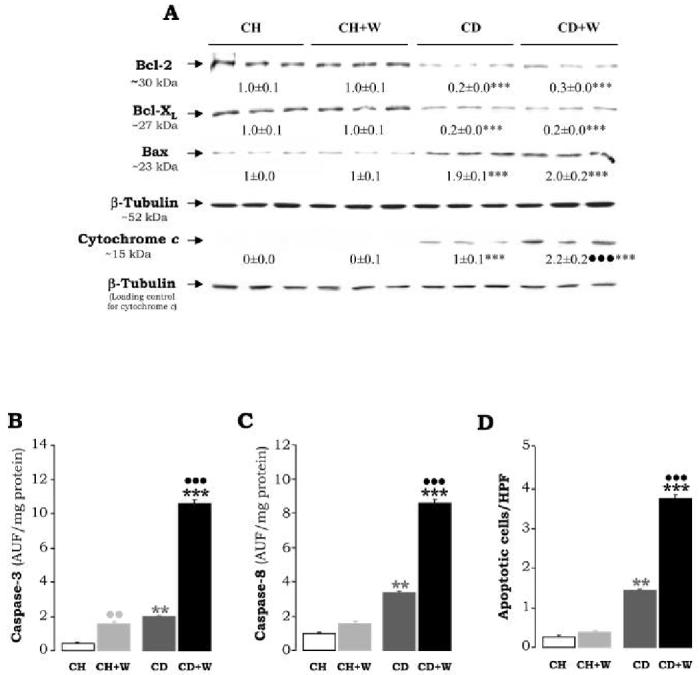
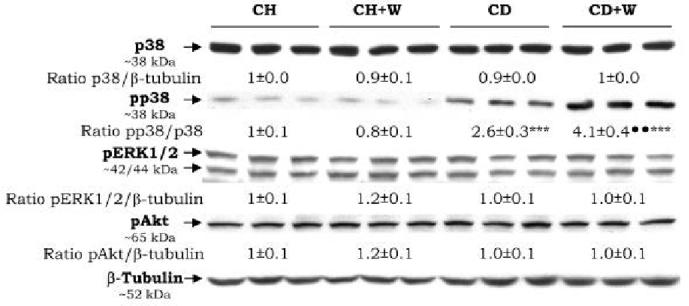
Results: Rats fed the CD diet plus whiskey showed increased liver damage compared to rats fed the CD diet, as demonstrated by H&E staining, elevated transaminases, steatosis, TNF-alpha levels, enhanced CYP2E1 activity, impaired antioxidant defense, elevated lipid peroxidation, and protein carbonyls. The combined treatment triggered an apoptotic response as determined by elevated Bax, caspase-3 activity, cytochrome-c release, and decreased Bcl-2 and Bcl-XL. Stellate cells were activated as increased expression of alpha-Sma was observed over that by the CD diet alone. The combined treatment shifted extracellular matrix remodeling towards a pro-fibrogenic response due to up-regulation of collagen I, TIMP1, and Hsp47 proteins, along with down-regulation of MMP13, MMP2, and MMP9 expression, proteases which degrade collagen I. These events were accompanied by increased phosphorylation of p38, a kinase that elevates collagen I.
Conclusions: Repeated alcohol binges in the context of mild steatosis may promote activation of stellate cells and contribute to liver injury.
Figures

Similar articles
-
Experimental IgA nephropathy secondary to hepatocellular injury induced by dietary deficiencies and heavy alcohol intake.Lab Invest. 1994 Jan;70(1):68-77. Lab Invest. 1994. PMID: 8302021
-
Choline deficiency augments and antibody to tumor necrosis factor-alpha attenuates endotoxin-induced hepatic injury.Alcohol Clin Exp Res. 1997 Sep;21(6):1037-41. Alcohol Clin Exp Res. 1997. PMID: 9309314
-
Effects of treatment with hydrogen sulfide on methionine-choline deficient diet-induced non-alcoholic steatohepatitis in rats.J Gastroenterol Hepatol. 2014 Jan;29(1):215-22. doi: 10.1111/jgh.12389. J Gastroenterol Hepatol. 2014. PMID: 24117897
-
Choline and hepatocarcinogenesis in the rat.Adv Exp Med Biol. 1995;375:65-74. doi: 10.1007/978-1-4899-0949-7_6. Adv Exp Med Biol. 1995. PMID: 7645429 Review.
-
Alcohol, oxidative stress and free radical damage.Proc Nutr Soc. 2006 Aug;65(3):278-90. doi: 10.1079/pns2006496. Proc Nutr Soc. 2006. PMID: 16923312 Review.
Cited by
-
Rodent Models of Alcoholic Liver Disease: Role of Binge Ethanol Administration.Biomolecules. 2018 Jan 13;8(1):3. doi: 10.3390/biom8010003. Biomolecules. 2018. PMID: 29342874 Free PMC article. Review.
-
Impact of binge drinking on alcoholic liver disease.Arch Pharm Res. 2025 Mar;48(3):212-223. doi: 10.1007/s12272-025-01537-1. Epub 2025 Mar 4. Arch Pharm Res. 2025. PMID: 40035998 Review.
-
The role of cytochrome c oxidase subunit Va in non-small cell lung carcinoma cells: association with migration, invasion and prediction of distant metastasis.BMC Cancer. 2012 Jun 29;12:273. doi: 10.1186/1471-2407-12-273. BMC Cancer. 2012. PMID: 22748147 Free PMC article.
-
Alcoholic liver disease: A current molecular and clinical perspective.Liver Res. 2018 Dec;2(4):161-172. doi: 10.1016/j.livres.2018.11.002. Epub 2018 Dec 12. Liver Res. 2018. PMID: 31214376 Free PMC article.
-
Oxidative stress modulates KLF6Full and its splice variants.Alcohol Clin Exp Res. 2012 Nov;36(11):1851-62. doi: 10.1111/j.1530-0277.2012.01798.x. Epub 2012 Apr 6. Alcohol Clin Exp Res. 2012. PMID: 22486562 Free PMC article.
References
-
- Powell E, Cooksley WG, Hanson R, Searle J, Halliday JW, Powell LW. The natural history of nonalcoholic steatohepatitis: a follow-up study of forty-two patients for up to 21 years. Hepatology. 1990;11:74–80. - PubMed
-
- Pares A, Caballeria J, Bruguera M, Torres M, Rodes J. Histological course of alcoholic hepatitis. Influence of abstinence, sex and extent of hepatic damage. J Hepatol. 1986;2:33–42. - PubMed
-
- Lombardi B, Ugazio G, Raick AN. Choline-deficiency fatty liver: relation of plasma phospholipids to liver triglycerides. Am J Physiol. 1966;210:31–36. - PubMed
-
- Brenner D, O’Hara M, Angel P, Chojkier M, Karin M. Prolonged activation of jun and collagenase genes by tumour necrosis factor-alpha. Nature. 1989;337:661–663. - PubMed
Publication types
MeSH terms
Substances
Grants and funding
LinkOut - more resources
Full Text Sources
Research Materials
Miscellaneous
