Clinical Trial
. 2007 May;129(1-2):130-42.
doi: 10.1016/j.pain.2006.10.010. Epub 2006 Dec 6.

Brain activity related to temporal summation of C-fiber evoked pain

Affiliations
Clinical Trial

Brain activity related to temporal summation of C-fiber evoked pain

Roland Staud et al. Pain. 2007 May.

Abstract

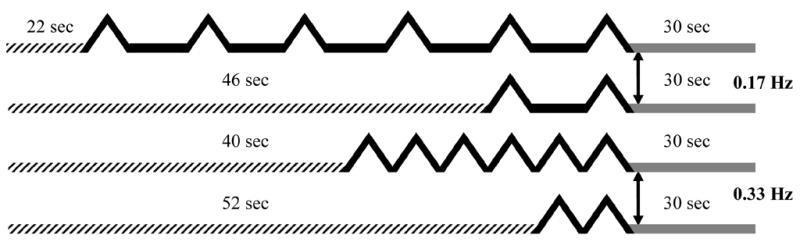
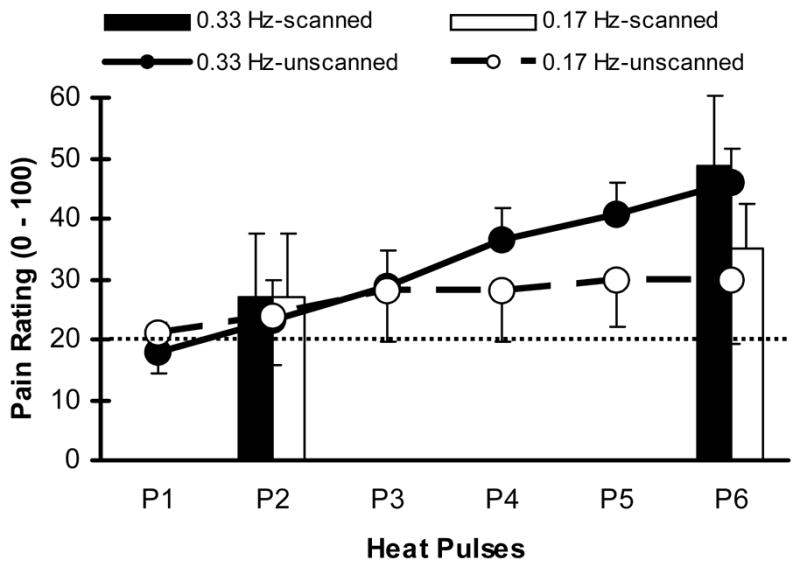
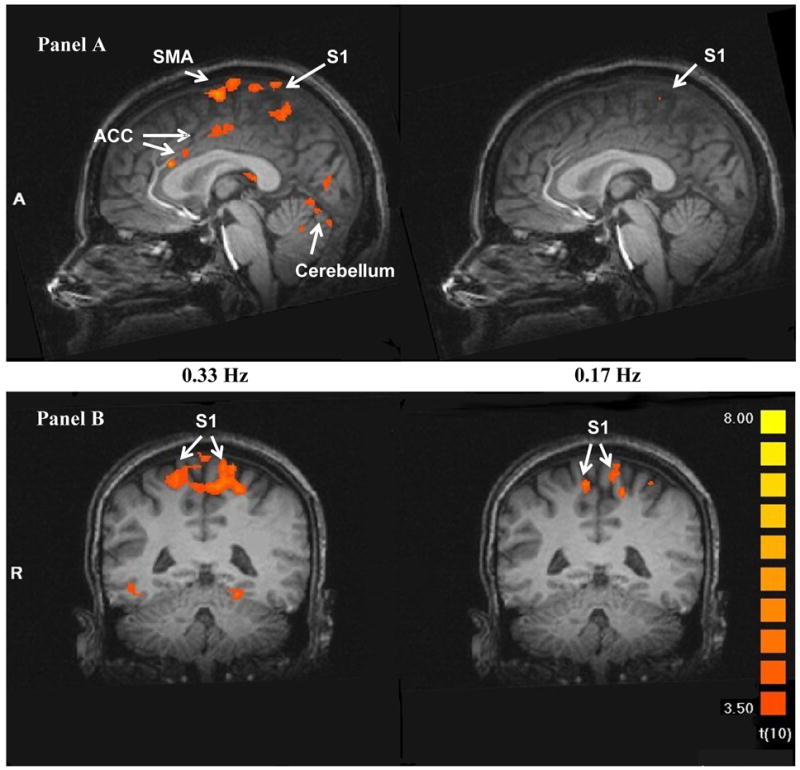
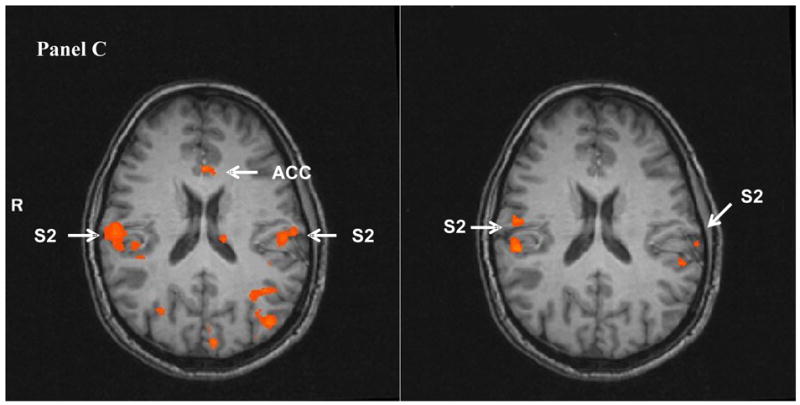
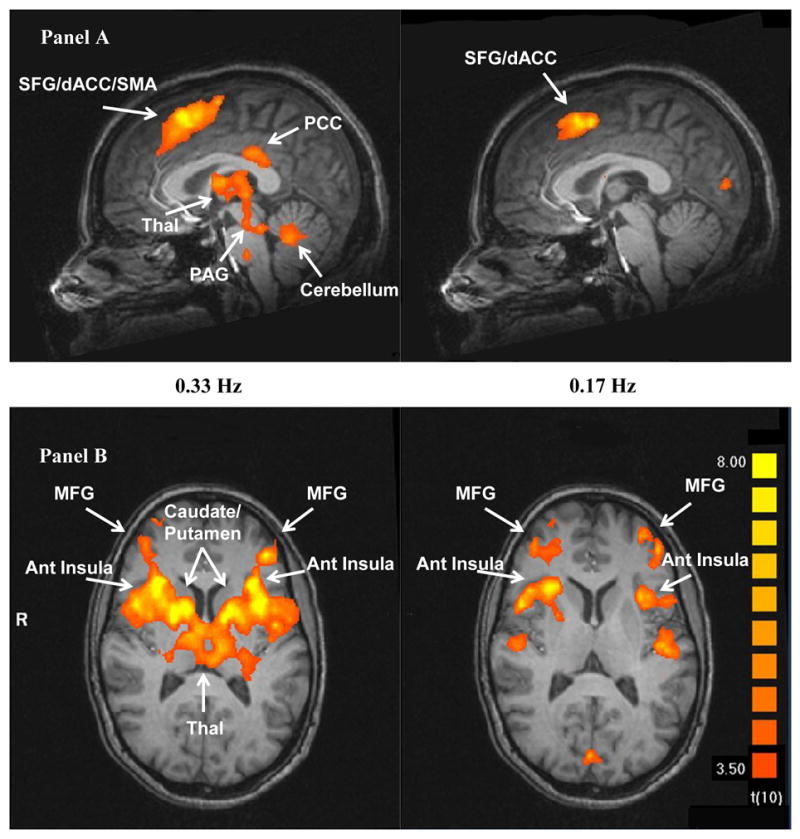
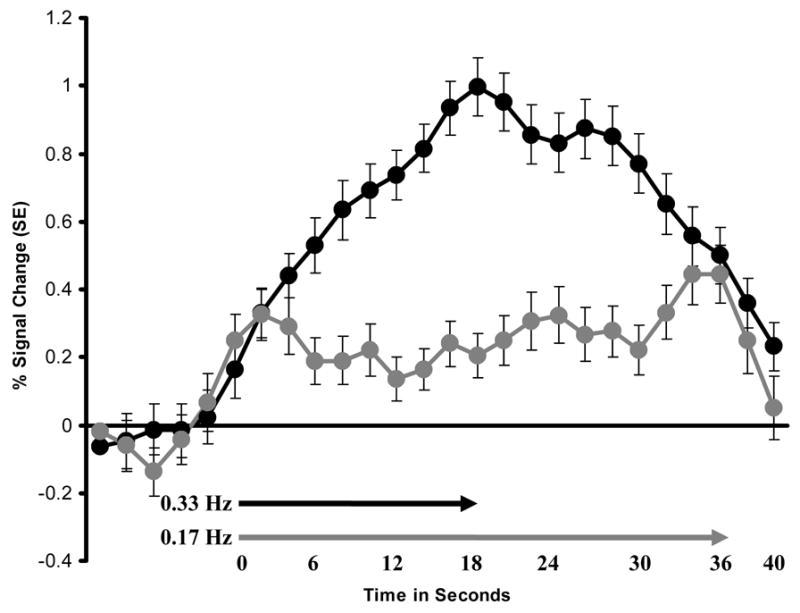
Temporal summation of "second pain" (TSSP) is considered to be the result of C-fiber-evoked responses of dorsal horn neurons, termed 'windup'. This phenomenon is dependent on stimulus frequency (0.33 Hz) and relevant for central sensitization and chronic pain. Previous brain imaging studies have only been used to characterize neural correlates of second pain but not its temporal summation. We utilized functional magnetic resonance imaging (fMRI) in healthy volunteers to measure brain responses associated with TSSP. Region of interest analysis was used to assess TSSP related brain activation. Eleven pain-free normal subjects underwent fMRI scanning during repetitive heat pulses to the right foot at 0.33 and 0.17 Hz. Stimulus intensities were adjusted to each individual's heat sensitivity to achieve comparable TSSP ratings of moderate pain in all subjects. As predicted, experimental pain ratings showed robust TSSP during 0.33 Hz but not 0.17 Hz stimuli. fMRI statistical maps identified several brain regions with stimulus and frequency dependent activation consistent with TSSP, including contralateral thalamus (THAL), S1, bilateral S2, anterior and posterior insula (INS), mid-anterior cingulate cortex (ACC), and supplemental motor areas (SMA). TSSP ratings were significantly correlated with brain activation in somatosensory areas (THAL, S1, left S2), anterior INS, and ACC. These results show that neural responses related to TSSP are evoked in somatosensory processing areas (THAL, S2), as well as in multiple areas that serve other functions related to pain, such as cognition (ACC, PFC), affect (INS, ACC, PAG), pre-motor activity (SMA, cerebellum), and pain modulation (rostral ACC).


Figures

Figure 1
Figure 1
Repetitive thermal stimuli at 0.33 Hz and 0.17 Hz were used to image TSSP-related brain activation. Previous psychophysical studies have shown that stimulus frequencies of ≥ 0.33 Hz resulted in robust TSSP whereas frequencies of < 0.33 Hz were only minimally effective. During scanning runs, two and six heat stimuli at 0.33 Hz and 0.17 Hz were applied to the right plantar surface, respectively. Each run lasted for 88 sec and was comprised of discarded acquisitions/baseline, repetitive thermal stimuli at 0.17 Hz or 0.33 Hz, and a 30 sec follow-up period. Although the four different trains used during scanning runs varied in the timing of the first stimulus, the last stimulus of each train always occurred at the same time point of a run. Duration of discarded acquisitions/baselines is indicated by hatched lines; stimuli at 0.33 Hz or 0.17 Hz are shown by solid black lines; the 30 sec follow-up periods are represented by solid grey lines.
Figure 2
Figure 2
Mean (SD) pain ratings of study subjects during two and six pulse trains at stimulus frequencies of 0.33 Hz and 0.17 Hz. All subjects were asked to remember the number ratings of the pain intensity related to the last heat pulse in a series until the end of each scanning run. Solid bars (0.33 Hz) and hatched bars (0.17 Hz) show these memorized pain ratings of 2-pulse and 6-pulse scanning runs, respectively. Solid (0.33 Hz heat pulses) and dotted lines (0.17 Hz heat pulses) depict mean pain ratings of each of six heat pulses during separate unscanned trials. Pain ratings of the 2nd or 6th heat pulse obtained during scanned and unscanned trials were not significantly different at either stimulus frequency (all p > .05). A rating of 20 represents pain threshold (dotted line).
Figure 3
Figure 3
Heat pulse related brain activity during TSSP stimuli at 0.33 Hz (left) and 0.17 Hz (right) in sagittal (Panel A) and transverse (Panel B and C) sections. The fMRI images depict the difference in brain activation between the last stimulus of short (two stimuli) and long trains (six stimuli) at 0.33 Hz (left) and 0.17 Hz (right), respectively. The brain activity in all a-priori selected ROIs was significantly greater after six compared to two heat pulses at 0.33 Hz (left), including S1, S2, PFC, SMA, THAL, ACC, and INS, (p < .004). Similar comparisons at 0.17 Hz (right), however, produced only increased brain activity in M1, S2, and posterior-INS. (THAL: thalamus; S: somato-sensory cortex; ACC: anterior cingulate cortex; PCC: posterior cingulate cortex; PFC: pre-frontal cortex; pINS: posterior insula; SMA: supplemental motor area).
Figure 3
Figure 3
Heat pulse related brain activity during TSSP stimuli at 0.33 Hz (left) and 0.17 Hz (right) in sagittal (Panel A) and transverse (Panel B and C) sections. The fMRI images depict the difference in brain activation between the last stimulus of short (two stimuli) and long trains (six stimuli) at 0.33 Hz (left) and 0.17 Hz (right), respectively. The brain activity in all a-priori selected ROIs was significantly greater after six compared to two heat pulses at 0.33 Hz (left), including S1, S2, PFC, SMA, THAL, ACC, and INS, (p < .004). Similar comparisons at 0.17 Hz (right), however, produced only increased brain activity in M1, S2, and posterior-INS. (THAL: thalamus; S: somato-sensory cortex; ACC: anterior cingulate cortex; PCC: posterior cingulate cortex; PFC: pre-frontal cortex; pINS: posterior insula; SMA: supplemental motor area).
Figure 4
Figure 4
Pain related brain activity of the last of six heat pulses at 0.33 Hz and 0.17 Hz in sagittal (Panel A) and transverse (Panel B) sections, respectively. In contrast to Fig. 3 which illustrates the relationship between brain activity and the number of heat pulses, theses fMRI images depict the association of brain activity with TSSP pain ratings. Significantly increased brain activation was detected in PFC, SMA, ACC, THAL, ACC, and INS (p < .005).
Figure 5
Figure 5
Representative sample of BOLD signal time courses related to six TSSP stimuli at 0.33 Hz (black circles) and 0.17 Hz (grey diamonds). ROI: right posterior-THAL. Arrows indicate the duration (in seconds) of six heat stimuli at 0.33 Hz (black arrow) and 0.17 Hz (grey arrow). Residual brain activation after 0.33 Hz 6-pulse trains took more than twice as long to resolve as expected. In contrast residual brain activity after 0.17 Hz 6-pulse trains resolved within the expected time period. Similar BOLD time courses were observed at all ROIs. TSSP: temporal summation of second pain; THAL: thalamus; BOLD: oxygen level dependent; SE: Standard error.

Similar articles

Cited by

References

    1. Arendt-Nielsen L, Petersen-Felix S, Fischer M, Bak P, Bjerring P, Zbinden AM. The effect of N-methyl-D-aspartate antagonist (ketamine) on single and repeated nociceptive stimuli: a placebo-controlled experimental human study. Anesth Analg. 1995;81:63–68. - PubMed
    1. Beck AT, Beamesderfer A. Assessment of depression: the depression inventory. In: Pichot P, editor. Psychological measurements in psychopharmacology. Basel; Karger: 1974. pp. 151–169. - PubMed
    1. Carpenter R. Neurophysiology. London: Hodder Arnold; 2002. pp. 1–320.
    1. Casey KL, Bushnell MC. Progress in Pain Research and Management. Vol. 18. Seattle: IASP Press; 2000. Pain Imaging.
    1. Chudler EH, Dong WK, Kawakami Y. Cortical nociceptive responses and behavioral correlates in the monkey. Brain Res. 1986;397:47–60. - PubMed

Publication types

MeSH terms