. 2007 Feb 9;144(3):1094-108.
doi: 10.1016/j.neuroscience.2006.10.041. Epub 2006 Dec 6.

Calcium permeable AMPA receptors and autoreceptors in external tufted cells of rat olfactory bulb

Affiliations

Calcium permeable AMPA receptors and autoreceptors in external tufted cells of rat olfactory bulb

J Ma et al. Neuroscience. .

Abstract

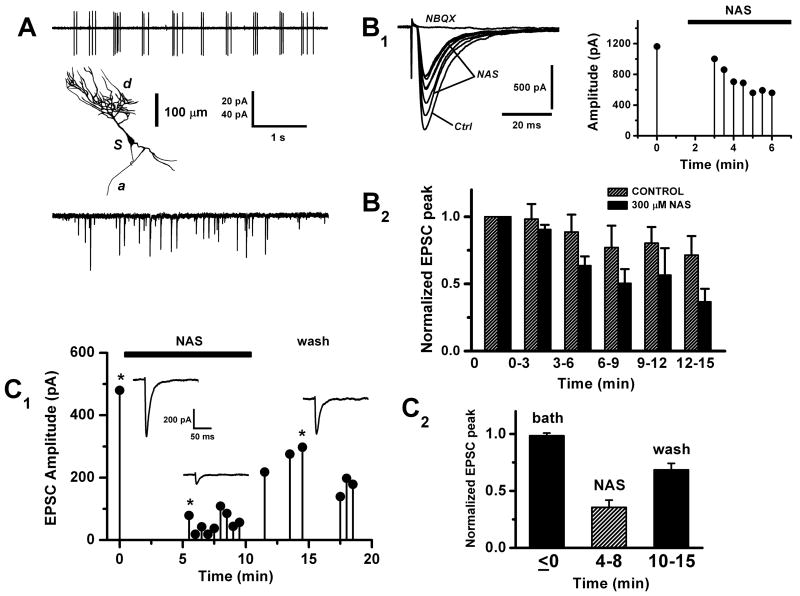
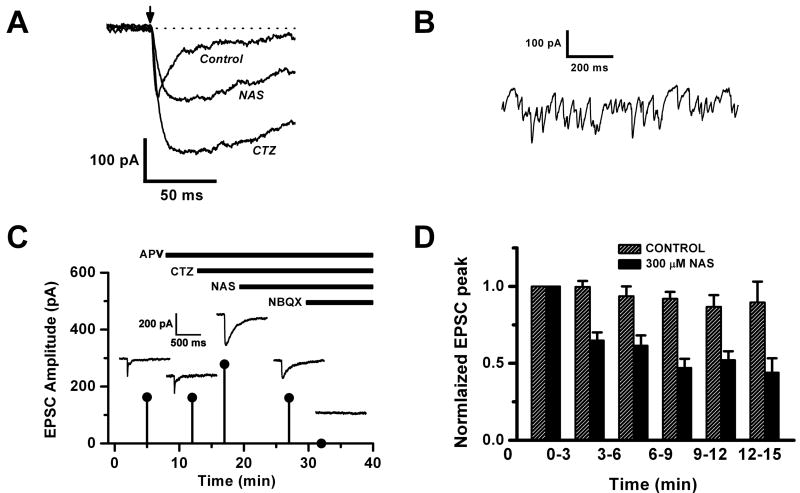
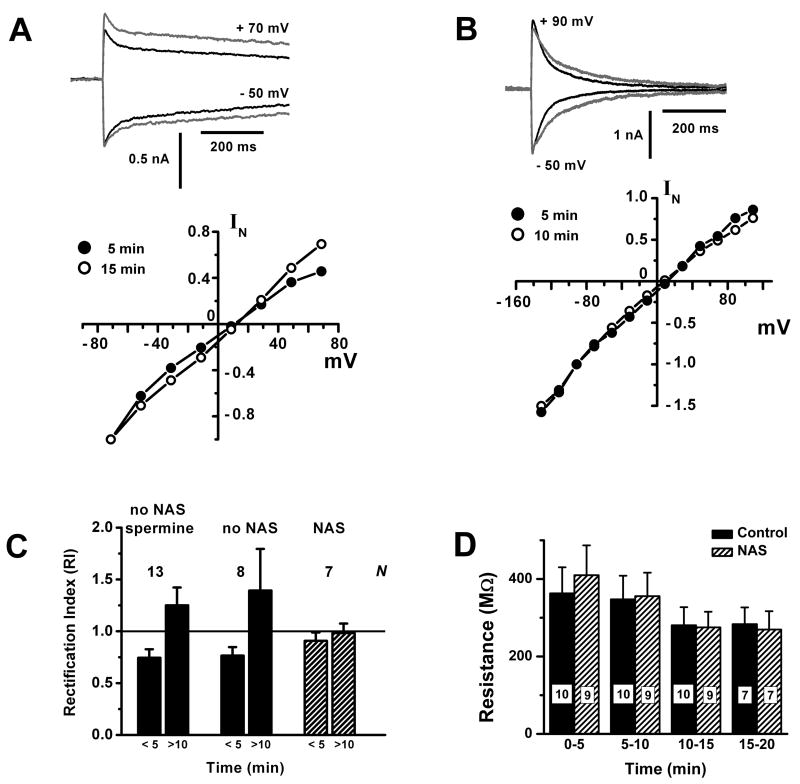
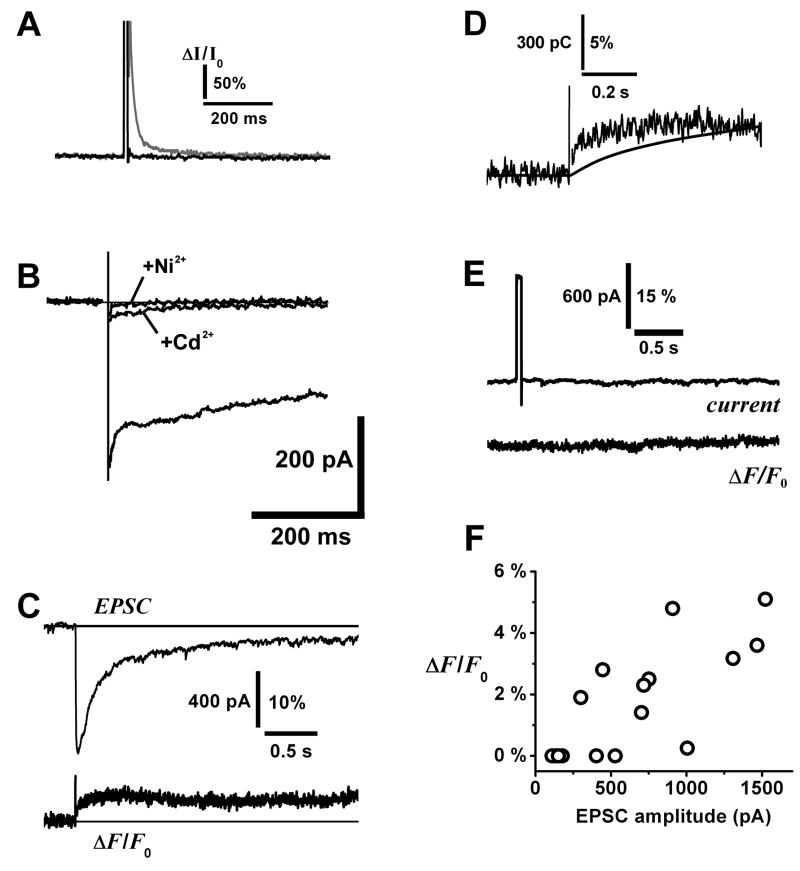
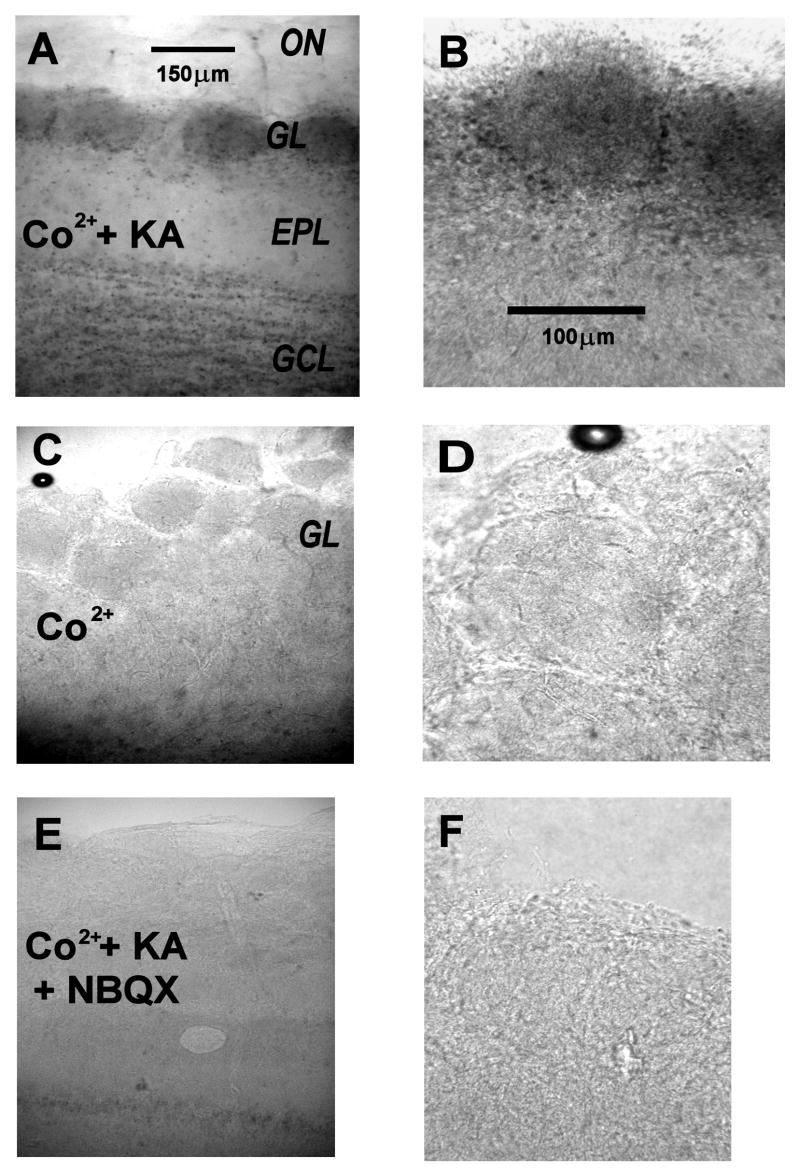
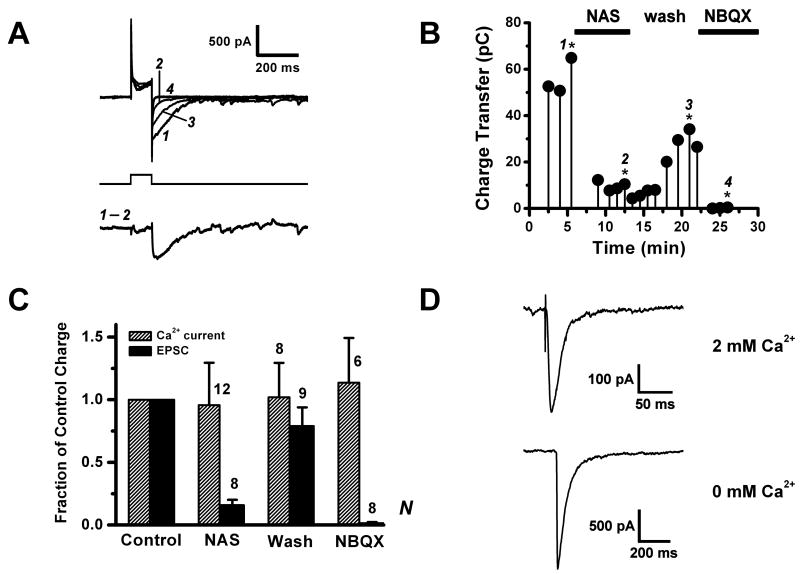
Glomeruli are functional units of the olfactory bulb responsible for early processing of odor information encoded by single olfactory receptor genes. Glomerular neural circuitry includes numerous external tufted (ET) cells whose rhythmic burst firing may mediate synchronization of bulbar activity with the inhalation cycle. Bursting is entrained by glutamatergic input from olfactory nerve terminals, so specific properties of ionotropic glutamate receptors on ET cells are likely to be important determinants of olfactory processing. Particularly intriguing is recent evidence that AMPA receptors of juxta-glomerular neurons may permeate calcium. This could provide a novel pathway for regulating ET cell signaling. We tested the hypothesis that ET cells express functional calcium-permeable AMPA receptors. In rat olfactory bulb slices, excitatory postsynaptic currents (EPSCs) in ET cells were evoked by olfactory nerve shock, and by uncaging glutamate. We found attenuation of AMPA/kainate EPSCs by 1-naphthyl acetyl-spermine (NAS), an open-channel blocker specific for calcium permeable AMPA receptors. Cyclothiazide strongly potentiated EPSCs, indicating a major contribution from AMPA receptors. The current-voltage (I-V) relation of uncaging EPSCs showed weak inward rectification which was lost after > approximately 10 min of whole-cell dialysis, and was absent in NAS. In kainate-stimulated slices, Co(2+) ions permeated cells of the glomerular layer. Large AMPA EPSCs were accompanied by fluorescence signals in fluo-4 loaded cells, suggesting calcium permeation. Depolarizing pulses evoked slow tail currents with pharmacology consistent with involvement of calcium permeable AMPA autoreceptors. Tail currents were abolished by Cd(2+) and (+/-)-4-(4-aminophenyl)-2,3-dioxo-6-nitro-1,2,3,4-tetrahydrobenzo[f]quinoxaline-7-sulfonamide (NBQX), and were sensitive to NAS block. Glutamate autoreceptors were confirmed by uncaging intracellular calcium to evoke a large inward current. Our results provide evidence that calcium permeable AMPA receptors reside on ET cells, and are divided into at least two functionally distinct pools: postsynaptic receptors at olfactory nerve synaptic terminals, and autoreceptors sensitive to glutamate released from dendrodendritic synapses.


Figures

Figure 1
Figure 1. Olfactory nerve stimulation evokes an NAS-sensitive conductance in external tufted cells
A. Properties of external tufted (ET) cells in olfactory bulb slices. Upper panel: cell-attached voltage-clamp recording of capacitance currents from an ET cell soma, showing the characteristic spontaneous burst discharge. Middle panel: morphology of an ET cell recovered by biocytin staining; d, dendritic tuft; s, soma; a, axon. Lower panel: spontaneous excitatory postsynaptic currents (EPSCs) recorded in whole cell mode (− 60 mV). Slices were perfused with standard artificial cerebrospinal fluid and whole-cell recordings made with K methylsulfate based internal solution. Vertical scale bar 20 pA (upper panel), 40 pA (lower panel). B. Polyamine block of the olfactory nerve shock-evoked EPSC in ET cells. B1, left panel: a series of shock-evoked whole-cell currents (−60 mV), the first recorded initially in control bath solution (Ctrl), 7 responses subsequently recorded after switching to 300 μM 1-naphthyl acetyl-spermine (NAS); the last trace shows NBQX (1 μM) abolished the response. A stimulus artefact indicates the timing of olfactory nerve shock. B1, right panel: plot of peak amplitude vs. time of the responses during wash in of NAS. The perfusion valve was switched at time = 0. B2, summary plot showing the change in the average EPSC amplitude over time, following switch to NAS perfusion. Hatched bars: normal run down of the EPSC in control cells recorded without NAS perfusion (n = 7 cells). Filled bars: cells exposed to NAS (n = 12 cells). On the abscissa, time = 0 corresponds to about 5 min after patch rupture, to allow the recording and series resistance to stabilize. For each cell, amplitude of the EPSC was normalized to the response at time = 0. Bath contained 100 μM APV, 150 μM BMI, internal solution 10 mM QX314. C. Recovery from polyamine block of the olfactory nerve shock-evoked EPSC. C1: plot of peak amplitude vs. time of the EPSC after switch to NAS perfusion (black bar), then after NAS was washed out of the bath. The inset traces (control, NAS and wash) correspond to the plot data points marked with a star (*). C2: summary plot showing the recovery of the EPSC after washing out NAS, normalized to time = 0 (n = 5 cells).
Figure 2
Figure 2. Glutamate uncaging evokes an NAS-sensitive conductance in external tufted cells
A. Rising phase and peak of the EPSC evoked by uncaging glutamate on the dendritic tuft of an ET cell. In the first trace labeled Control, the bath contained 100 μM APV to isolate an AMPA/kainate current. Second trace shows that addition of 100 μM cyclothiazide (CTZ) amplified the AMPA receptor component of the EPSC and prolonged both the time to peak and the decay. In the third trace, addition of 300 μM NAS attenuated the response 50%, leaving the kinetics unaltered. Bath contained 150 μM BMI, 150 μM Cd2+, 1 μM TTX and 1 mM MNI-caged glutamate, uncaged with a nitrogen laser (300 μJ, 4 ns). Arrow shows timing of laser pulse. B. Spontaneous EPSCs recorded from an ET cell in 100 μM CTZ. The bath also contained 1 μM TTX, 50 μM BMI, 15 μM dCK and 150 μM Cd2+. C. Plot of peak amplitude vs. time of the uncaging EPSC after successive administration of drugs: 100 μM APV, 100 μM CTZ, 300 μM NAS and 1 μM NBQX (same cell as shown in 2A). Insets show the actual traces recorded. D. Summary plot showing the change in the average uncaging EPSC amplitude over time, following switch to NAS perfusion. Hatched bars: normal run down of the uncaging EPSC in control cells recorded without NAS perfusion (n = 18 cells). Filled bars: cells exposed to 300 μM NAS (n = 13 cells, 9 recorded by whole-cell, 4 by perforated patch). Time = 0 corresponds to about 5 min after patch rupture, and amplitudes were normalized to this time point. Bath solution contained 15 μM dCK or 100 μM APV, 150 μM BMI, internal solution 10 mM QX314. Uncaging data obtained from using flash lamp and nitrogen laser are pooled.
Figure 3
Figure 3. Glutamate uncaging evokes an inwardly rectifying conductance in external tufted cells
A. Weak inward rectification is lost over time. Upper panel: plots of inward and outward uncaging currents (− 50 mV and +70 mV) recorded at 5 min (black trace) and 15 min (gray trace) after patch rupture. Lower panel: I-V curves obtained at 5 min (filled circles) and 15 min (open circles), showing loss of inward rectification. EPSC amplitudes were normalized to the values at − 71 mV. Bath solution contained 500 μM MNI-caged glutamate, 15 μM dCK, 50 μM BMI, 1 μM TTX, 20 mM TEA, 300 μM Cd2+. B. Weak inward rectification is absent in NAS. Upper panel: plots of inward and outward uncaging currents (− 50 mV and +90 mV) recorded at 5 min (black trace) and 10 min (gray trace) after patch rupture. Lower panel: I-V curves obtained at 5 min (filled circles) and 10 min (open circles), showing lack of inward rectification or wash out effects. EPSC amplitudes were normalized to the values at − 71 mV. Bath solution as in 3A, but with 300 μM NAS. C. Summary of the changes in rectification index (RI) of I-V curves obtained at early (< 5 min) and late (> 10 min) times, in the absence (filled bars) or presence (hatched bars) of NAS. In the former group, also shown are results from a group in which 75 – 250 μM spermine included in the internal solution did not delay the loss of inward rectification. Number of cells (N) is indicated for each group. D. Average cell input resistance (MΩ) at different times after establishing a whole-cell recordings from ET cells, either with (hatched bars) or without (solid bars) wash-in of 300 μM NAS. Control bath solution was the same as in 3A. For the wash-in trials (hatched), the NAS concentration in the bath was stable after > 5 min. Input resistance was obtained from applying −30 mV hyperpolarizing pulses from a holding potential of − 60 mV, without compensating series resistance (8 – 10 MΩ pipette). Numerical labels on the bars indicate the number of cells in each measurement.
Figure 4
Figure 4. Fluorometric measurement of calcium transients evoked by glutamate uncaging in external tufted cells
A. Photodiode control responses to laser uncaging flash. At higher laser power (10 mW at focal plane), the flash induced a slow transient artifact (gray trace) in the detector. We adjusted laser power to a range (0.25 – 0.5 mW) that was sufficient to uncage glutamate and evoke large EPSCs without generating the slow artifact (black trace). ΔI/I0 = relative change in detector current over baseline current I0. B. Block of voltage-activated Ca2+ currents in an ET cell. The lower trace is the Ca2+ current in control condition (HEPES buffered bath solution with 1 μM TTX, 3 mM Cs+, 3 mM 4-aminopyridine, 40 mM TEA; Cs-methanesulfonate internal solution), the middle trace after addition of 150 μM Cd2+, and the upper flat trace with 150 μM Cd2+ and 250 μM Ni2+. Currents were activated under voltage clamp by stepping from − 60 mV to 0 mV. A whole-cell capacitance transient was subtracted from the records, and an imperfectly cancelled transient (< 10 ms) has been blanked from the traces. Similar data were obtained from n = 2 ET cells. C. Upper trace: AMPA/kainate EPSC evoked by uncaging glutamate on the soma and proximal dendrite of an ET cell. Lower trace: relative fluorescence change ΔF/F0 in fluo-4 detected by photodiode, fluorescence was spatially summed over the soma and proximal dendrite, the area illuminated by the arc lamp. D. Overlay of the rising phases of ΔF/F0 and integrated charge of the EPSC in 4C. E. Absence of detectable fluo-4 fluorescence change after applying a 50 ms depolarizing voltage pulse (− 60 mV to 0 m V) to an ET cell to test for activation of voltage-gated Ca2+ channels in 200 μM Cd2+. This same cell responded to glutamate uncaging with a large EPSC and a sustained fluorescence transient, similar to 4C. F. Correlation plot of peak amplitude of fluo-4 fluorescence signal against peak amplitude of AMPA/kainate EPSC (data from n = 12 cells).
Figure 5
Figure 5. AMPA/kainate receptor-dependent cobalt uptake in the glomerular layer of the olfactory bulb
A, B: Horizontal olfactory bulb slices were exposed in vitro to 250 μM kainate (KA) in the presence of 5 mM CoCl2 (CO). After fixing, the slices were stained for cobalt by treatment with ammonium sulfide, which precipitates cobalt sulfide (dark areas). A: low magnification of a treated slice, showing strong staining of glomeruli (GL, dark ovoid regions on the left). The olfactory nerve layer (ON) was unstained, the external plexiform layer (EPL) weakly and the granule cell layer (GCL) more strongly stained. Scale bar: 150 μm. B: At higher magnification, staining of individual juxtaglomerular cell somata can be discerned. Scale bar: 100 μm. C, D: Low (C) and high (D) magnification views of a control slice treated with cobalt, without kainate stimulation. No staining is apparent. Scales as in 5A, 5B. E, F: Low (E) and high (F) magnification views of a control slice treated with cobalt, stimulated with kainate and with 100 μM NBQX to completely block AMPA/kainate receptors. No staining is apparent. Scales as in 5A, 5B.
Figure 6
Figure 6. A polyamine sensitive AMPA autoreceptor in external tufted cells
A. Tail current evoked by voltage pulse depolarization (−60 to 0 mV, 100 ms) of an ET cell to trigger dendritic release of glutamate. Upper traces: a sequence of tail currents; control (1), after perfusion with 300 μM NAS (2), after wash out of NAS (3), and after addition of 10 μM NBQX (4). Lower trace: The NAS-sensitive component of the tail current, isolated by digital subtraction of traces 1 and 2 in A. The bath contained 15 μM dCK, 150 μM bicuculline, 2 mM TEA, 1 μM TTX and 100 μM CTZ. The internal solution contained CsMeSO4 and 30 mM L-glutamate. B. Plot of charge transfer vs. time of the tail current, after subtraction of the capacitance charge transfer estimated in 10 μM NBQX, for the cell in A. The labeled data points (with stars) correspond to traces 1 – 4 in 6A. C. Summary plot comparing charge transfers of the tail current and the calcium current (calculated during the 0 mV pulse) in the control condition, under NAS perfusion, after NAS wash out, and in NBQX. The Ca2+ current was unaffected by NAS, whereas the tail current was strongly suppressed. D. Inward currents evoked by intracellular flash photolysis of caged calcium (DM-Nitrophen). Upper trace was recorded in external solution containing 2 mM Ca2+, lower trace in 0 mM external Ca2+. Bath solution contained 500 μM Cd2+, 26 mM NaHEPES, and CTZ was omitted.

Similar articles

Cited by

References

    1. Ajima A, Hensch T, Kado RT, Ito M. Differential blocking action of Joro spider toxin analog on parallel fiber and climbing fiber synapses in cerebellar Purkinje cells. Neurosci Res. 1991;12:281–286. - PubMed
    1. Antal M, Eyre M, Finklea B, Nusser Z. External tufted cells in the main olfactory bulb form two distinct subpopulations. Eur J Neurosci. 2006;24:1124–1136. - PMC - PubMed
    1. Aroniadou-Anderjaska V, Ennis M, Shipley MT. Glomerular synaptic responses to olfactory nerve input in rat olfactory bulb slices. Neuroscience. 1997;79:425–434. - PubMed
    1. Asami T, Kagechika H, Hashimoto Y, Shudo K, Miwa A, Kawai N, Nakajima T. Acylpolyamines mimic the action of joro spider toxin (JSTX) on crustacean muscle glutamate receptors. Biomed Res. 1989;10:185–189.
    1. Aungst JL, Heyward PM, Puche AC, Karnup SV, Hayar A, Szabo G, Shipley MT. Centre-surround inhibition among olfactory bulb glomeruli. Nature. 2003;426:623–629. - PubMed

Publication types

MeSH terms