

The structure of the minimal relaxase domain of MobA at 2.1 A resolution
- PMID: 17157875
- PMCID: PMC1894915
- DOI: 10.1016/j.jmb.2006.11.031
The structure of the minimal relaxase domain of MobA at 2.1 A resolution
Abstract
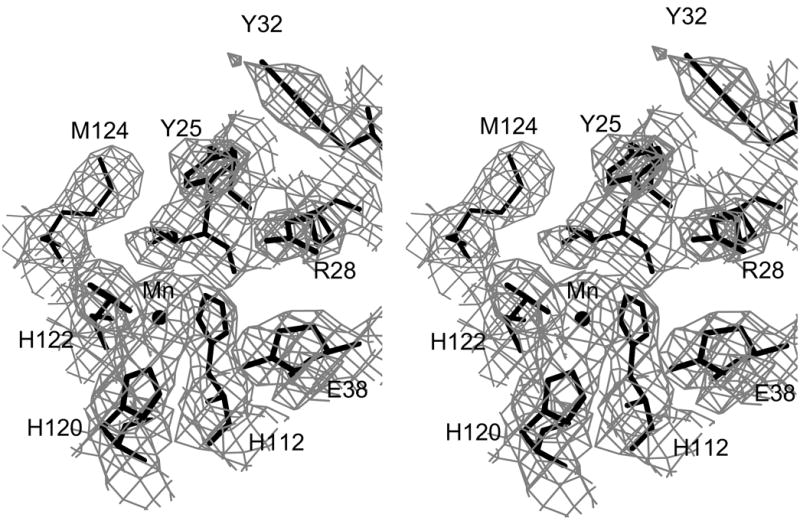
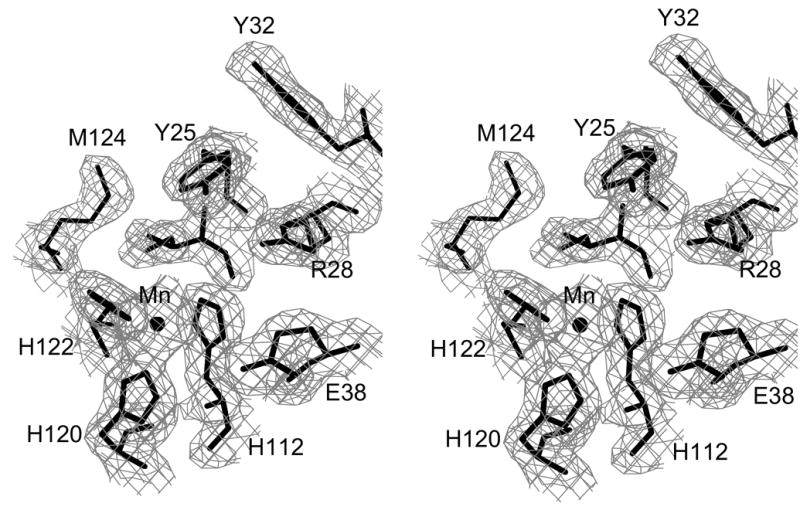
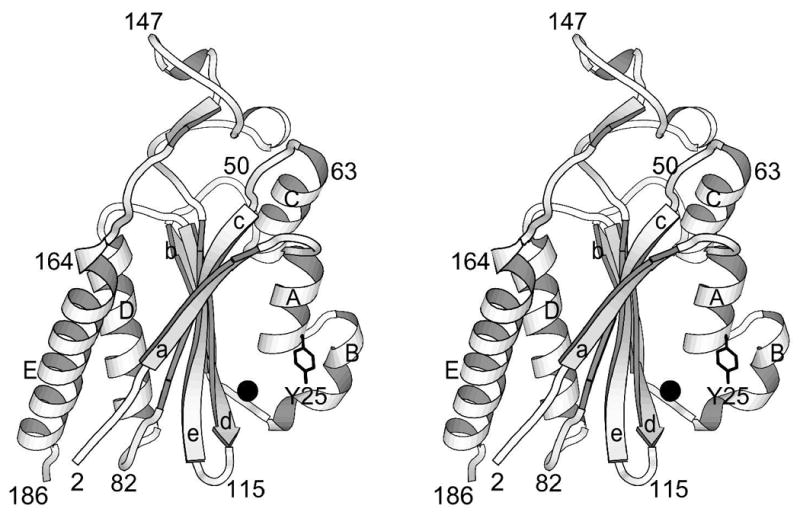
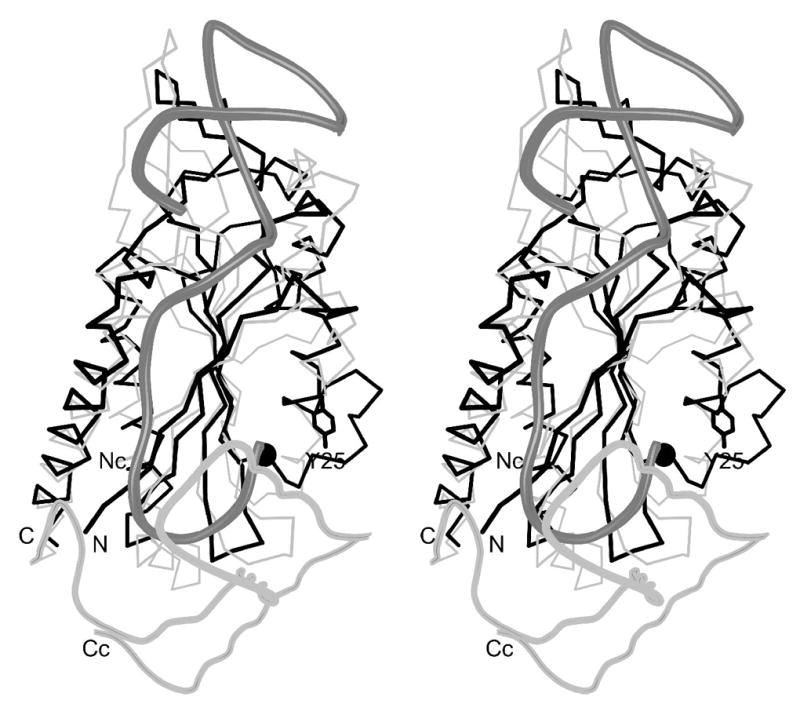
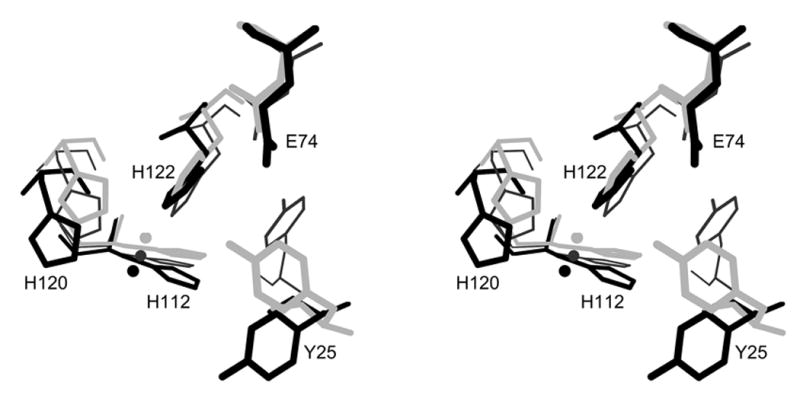
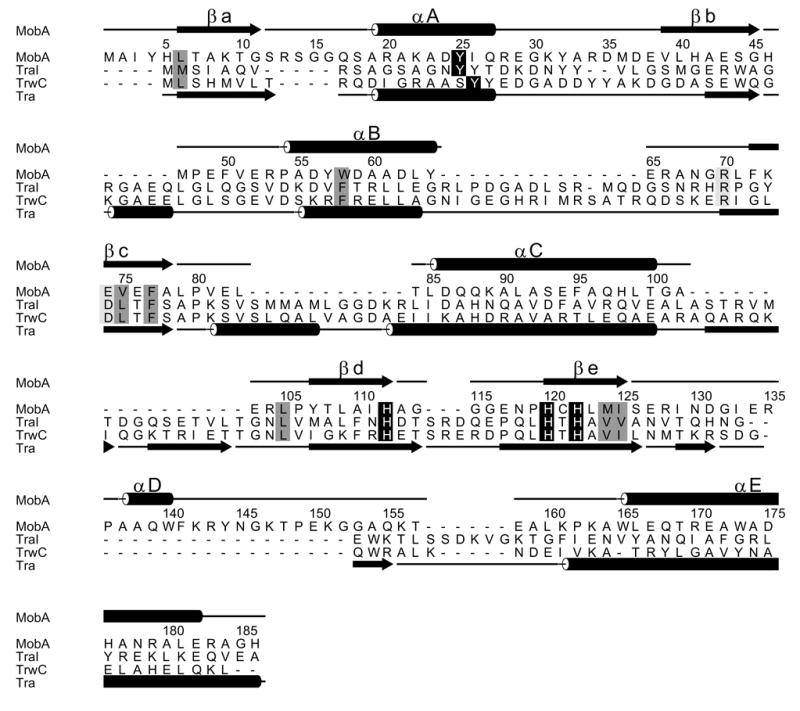
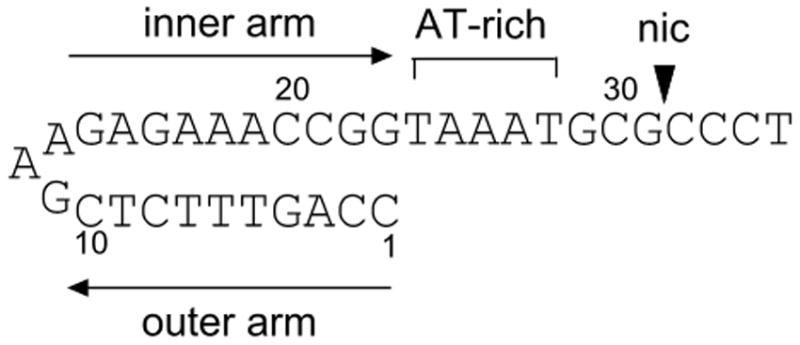
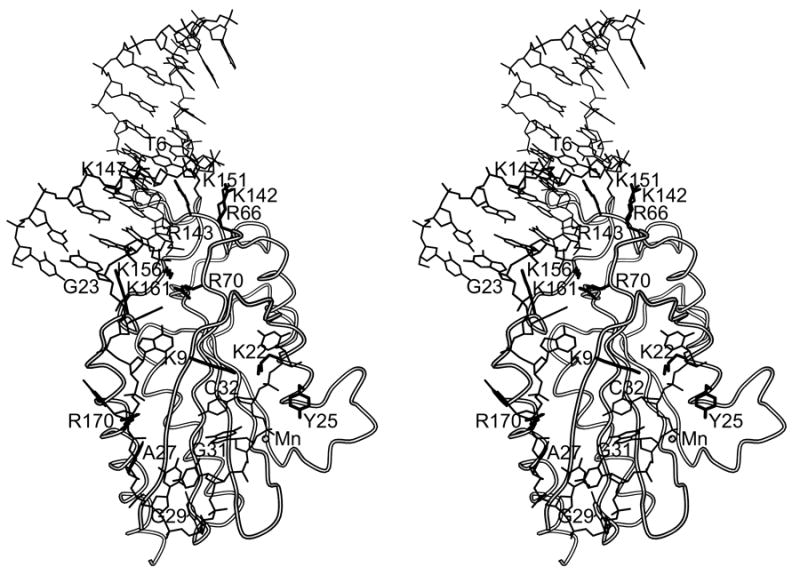
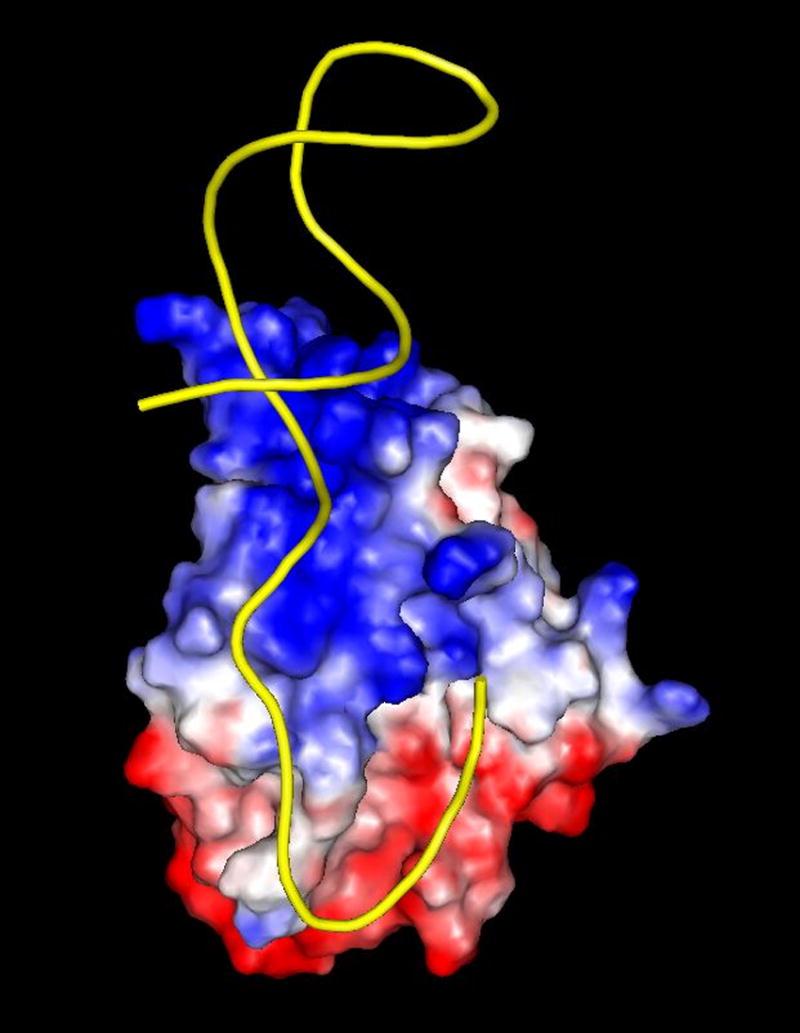
The plasmid R1162 encodes proteins that enable its conjugative mobilization between bacterial cells. It can transfer between many different species and is one of the most promiscuous of the mobilizable plasmids. The plasmid-encoded protein MobA, which has both nicking and priming activities on single-stranded DNA, is essential for mobilization. The nicking, or relaxase, activity has been localized to the 186 residue N-terminal domain, called minMobA. We present here the 2.1 A X-ray structure of minMobA. The fold is similar to that seen for two other relaxases, TraI and TrwC. The similarity in fold, and action, suggests these enzymes are evolutionary homologs, despite the lack of any significant amino acid similarity. MinMobA has a well- defined target DNA called oriT. The active site metal is observed near Tyr25, which is known to form a phosphotyrosine adduct with the substrate. A model of the oriT substrate complexed with minMobA has been made, based on observed substrate binding to TrwC and TraI. The model is consistent with observations of substrate base specificity, and provides a rationalization for elements of the likely enzyme mechanism.
Figures
Similar articles
-
A new domain of conjugative relaxase TrwC responsible for efficient oriT-specific recombination on minimal target sequences.Mol Microbiol. 2006 Nov;62(4):984-96. doi: 10.1111/j.1365-2958.2006.05437.x. Epub 2006 Oct 13. Mol Microbiol. 2006. PMID: 17038118
-
The mechanism and control of DNA transfer by the conjugative relaxase of resistance plasmid pCU1.Nucleic Acids Res. 2010 Sep;38(17):5929-43. doi: 10.1093/nar/gkq303. Epub 2010 May 6. Nucleic Acids Res. 2010. PMID: 20448025 Free PMC article.
-
Recognition and processing of the origin of transfer DNA by conjugative relaxase TrwC.Nat Struct Biol. 2003 Dec;10(12):1002-10. doi: 10.1038/nsb1017. Epub 2003 Nov 16. Nat Struct Biol. 2003. PMID: 14625590
-
Nicking by transesterification: the reaction catalysed by a relaxase.Mol Microbiol. 1997 Sep;25(6):1011-22. doi: 10.1046/j.1365-2958.1997.5241885.x. Mol Microbiol. 1997. PMID: 9350859 Review.
-
Elements in the co-evolution of relaxases and their origins of transfer.Plasmid. 2005 Mar;53(2):113-8. doi: 10.1016/j.plasmid.2004.12.007. Plasmid. 2005. PMID: 15737398 Review.
Cited by
-
Molecular basis of antibiotic multiresistance transfer in Staphylococcus aureus.Proc Natl Acad Sci U S A. 2013 Feb 19;110(8):2804-9. doi: 10.1073/pnas.1219701110. Epub 2013 Jan 28. Proc Natl Acad Sci U S A. 2013. PMID: 23359708 Free PMC article.
-
A degenerate primer MOB typing (DPMT) method to classify gamma-proteobacterial plasmids in clinical and environmental settings.PLoS One. 2012;7(7):e40438. doi: 10.1371/journal.pone.0040438. Epub 2012 Jul 11. PLoS One. 2012. PMID: 22792321 Free PMC article.
-
Sequence-Directed Covalent Protein-DNA Linkages in a Single Step Using HUH-Tags.J Am Chem Soc. 2017 May 24;139(20):7030-7035. doi: 10.1021/jacs.7b02572. Epub 2017 May 16. J Am Chem Soc. 2017. PMID: 28481515 Free PMC article.
-
DNA processing by the MOBH family relaxase TraI encoded within the gonococcal genetic island.Nucleic Acids Res. 2019 Sep 5;47(15):8136-8153. doi: 10.1093/nar/gkz577. Nucleic Acids Res. 2019. PMID: 31276596 Free PMC article.
-
The MobM relaxase domain of plasmid pMV158: thermal stability and activity upon Mn2+ and specific DNA binding.Nucleic Acids Res. 2011 May;39(10):4315-29. doi: 10.1093/nar/gkr049. Epub 2011 Feb 3. Nucleic Acids Res. 2011. PMID: 21296755 Free PMC article.
References
-
- Zechner EL, de la Cruz F, Eisenbrandt R, Grahn AM, Koraimann G, Lanka E, Muth G, Pansegrau W, Thomas CM, Wilkins BM, Zatyka M. Conjugative DNA Transfer Processes. In: Thomas CM, editor. The Horizontal Gene Pool: Bacterial Plasmids and Gene Spread. Harwood Academic Publishers; Amsterdam: 2000. pp. 87–174.
-
- Francia MV, Varsaki A, Garcillan-Barcia MP, Latorre A, Drainas C, de la Cruz F. A classification scheme for mobilization regions of bacterial plasmids. FEMS Microbiol Rev. 2004;28:79–100. - PubMed
-
- Nagai H, Roy CR. Show me the substrates: modulation of host cell function by type IV secretion systems. Cell Microbiol. 2003;5:373–83. - PubMed
-
- Vogel JP, Andrews HL, Wong SK, Isberg RR. Conjugative transfer by the virulence system of Legionella pneumophila. Science. 1998;279:873–6. - PubMed
Publication types
MeSH terms
Substances
Associated data
- Actions
Grants and funding
LinkOut - more resources
Full Text Sources
Other Literature Sources
