. 2007;35(1):152-64.
doi: 10.1093/nar/gkl1032. Epub 2006 Dec 7.

Global analysis of microRNA target gene expression reveals that miRNA targets are lower expressed in mature mouse and Drosophila tissues than in the embryos

Affiliations

Global analysis of microRNA target gene expression reveals that miRNA targets are lower expressed in mature mouse and Drosophila tissues than in the embryos

Zhenbao Yu et al. Nucleic Acids Res. 2007.

Abstract

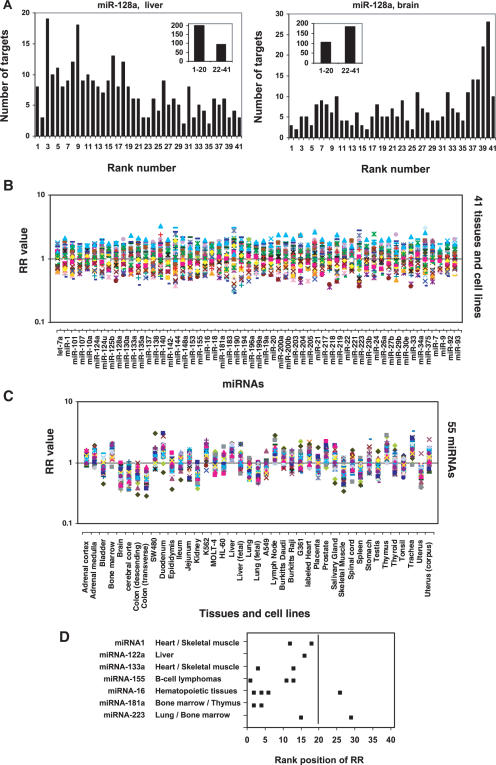
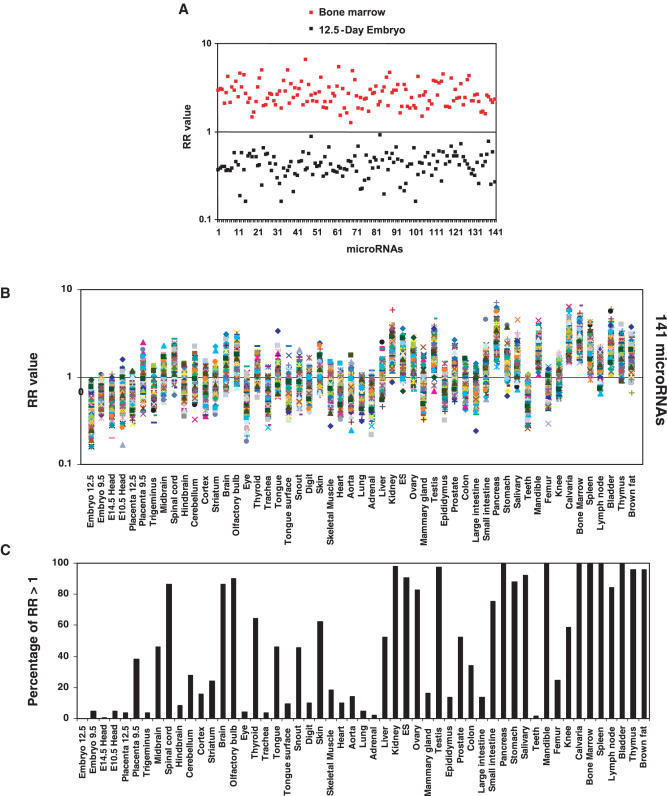
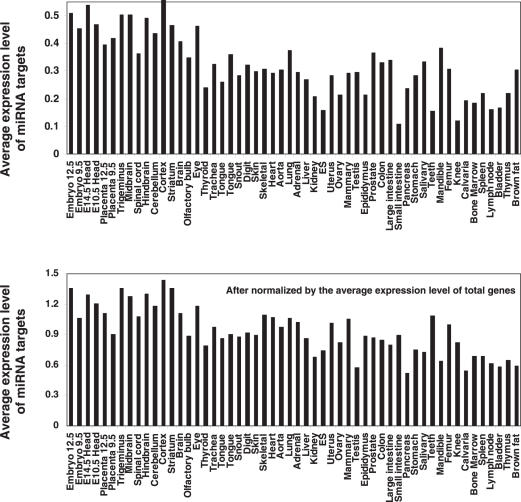
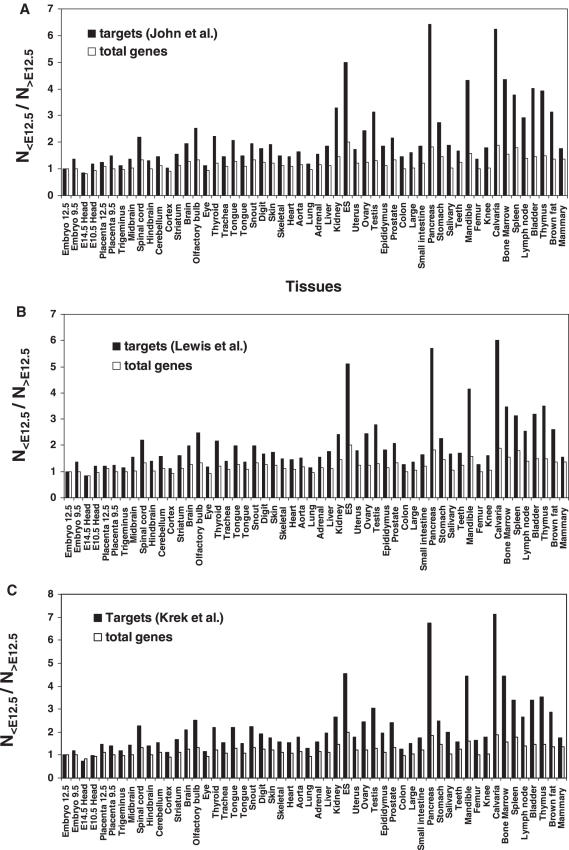
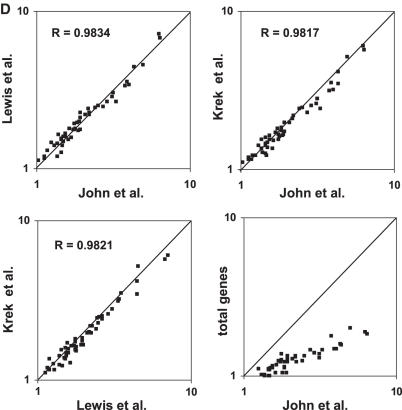
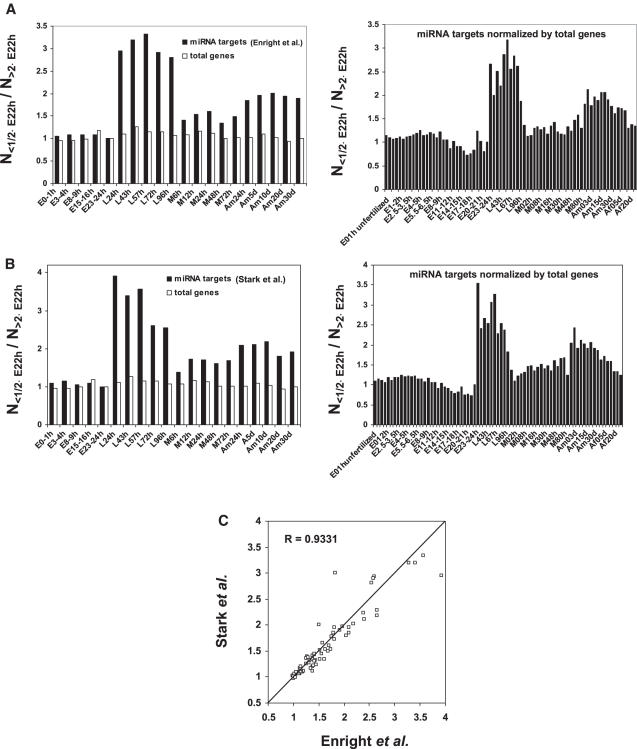
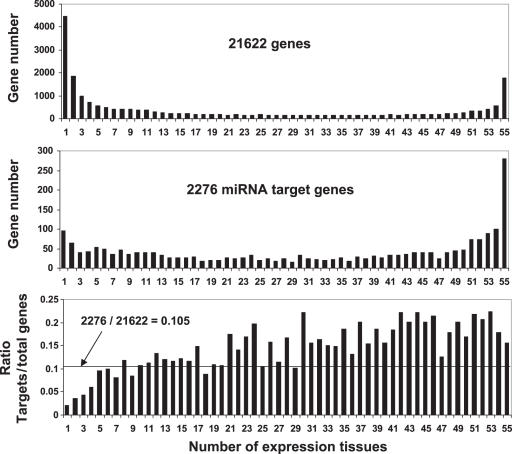
MicroRNAs (miRNAs) are non-coding small RNAs of approximately 22 nt that regulate the gene expression by base pairing with target mRNAs, leading to mRNA cleavage or translational repression. It is currently estimated that miRNAs account for approximately 1% of predicted genes in higher eukaryotic genomes and that up to 30% of genes might be regulated by miRNAs. However, only very few miRNAs have been functionally characterized and the general functions of miRNAs are not globally studied. In this study, we systematically analyzed the expression patterns of miRNA targets using several public microarray profiles. We found that the expression levels of miRNA targets are lower in all mouse and Drosophila tissues than in the embryos. We also found miRNAs more preferentially target ubiquitously expressed genes than tissue-specifically expressed genes. These results support the current suggestion that miRNAs are likely to be largely involved in embryo development and maintaining of tissue identity.


Figures

Figure 1
Figure 1
Ranking of the expression levels of miRNA targets in human tissues. Each miRNA target was ranked over 41 human tissue samples as described in the ‘Materials and Methods’ according to its expression level. The RR means the ratio of the total number (NRank 1–20) of the miRNA targets with a lower rank number (between 1 and 20) to the total number (NRank 22–41) of the miRNA targets with a higher rank number (between 22 and 41). The RR value of the target genes of each miRNA in a tissue is normalized by the RR value of the total genes in the same tissue. (A) Ranking results of the 295 targets of miR-128a in liver and brain. (B) The RR values of the 55 miRNAs are plotted as a function of human tissues and cell lines. (C) The RR values over the 41 tissues and cell lines are plotted as a function of miRNAs. (D) For each miRNA, the RR values of its targets were ranked across the 41 samples from higher value to lower value. The miRNAs shown are highly specifically expressed in the indicated tissues as demonstrated previously for miRNA-1 and miRNA-133 in references (51,54); miRNA-122 in reference (60); miRNA-16, miRNA-142, miRNA-181 and miRNA-223 in reference (61); miRNA-155 in references (52,53). The rank positions in the indicated tissues were obtained and shown in the figure.
Figure 2
Figure 2
Ranking of the expression levels of miRNA targets in mouse tissues. Each miRNA target gene was ranked over 55 mouse samples according to its relative expression level in the respective sample as described in the ‘Materials and Methods’. The RR means the ratio of the total number (NRank 1–27) of the miRNA targets with a lower rank number (between 1 and 27) to the total number (NRank 29–55) of the miRNA targets with a higher rank number (between 29 and 55). The RR value of the target genes of each miRNA in a tissue is normalized by the RR value of the total genes in the same tissue. (A) Comparison of the target gene expressions (RR values) of the 141 miRNAs in bone marrow and 12.5-day embryo. (B) RR values over 141 miRNAs are plotted as a function of mouse tissues. (C) The percentage of miRNAs, of which the total number (NRank 1–27) of the targets with lower rank number (between 1 and 27) is more than the number (NRank 29–55) of the targets with higher rank number (between 29 and 55) (RR value >1).
Figure 3
Figure 3
Overall expression levels of miRNA targets in mouse tissues. The average expression levels of the miRNA targets and the total genes in each mouse tissue were calculated using a microarray dataset (39), which contains 21 622 mouse genes including 2276 miRNA targets published by John et al. (19).
Figure 4
Figure 4
Comparison of the expression levels of miRNA target genes in mouse tissues with that in 12.5-day embryo. (A–C) A microarray dataset containing 21 622 genes over 55 mouse samples published by Zhang et al. (39) was used in this analysis. In each individual tissue, the expression level of each gene was compared with that in 12.5-day embryo. The number of the miRNA targets whose expression level in a given tissue is lower than that in 12.5-day embryo (N<E12.5) is divided by the number of miRNA targets with an expression level in the same tissue higher than that in 12.5-day embryo (N>E12.5). Three sets of miRNA targets published by John et al. (19), Lewis et al. (23) and Krek et al. (21), respectively were analyzed. Each of them contains more than two thousand miRNA targets found in the microarray dataset. As control, the same calculation was made for total genes. (D) Correlation between the data (N<E12.5/N>E12.5) obtained using three different miRNA target datasets.
Figure 4
Figure 4
Comparison of the expression levels of miRNA target genes in mouse tissues with that in 12.5-day embryo. (A–C) A microarray dataset containing 21 622 genes over 55 mouse samples published by Zhang et al. (39) was used in this analysis. In each individual tissue, the expression level of each gene was compared with that in 12.5-day embryo. The number of the miRNA targets whose expression level in a given tissue is lower than that in 12.5-day embryo (N<E12.5) is divided by the number of miRNA targets with an expression level in the same tissue higher than that in 12.5-day embryo (N>E12.5). Three sets of miRNA targets published by John et al. (19), Lewis et al. (23) and Krek et al. (21), respectively were analyzed. Each of them contains more than two thousand miRNA targets found in the microarray dataset. As control, the same calculation was made for total genes. (D) Correlation between the data (N<E12.5/N>E12.5) obtained using three different miRNA target datasets.
Figure 5
Figure 5
Analysis of the expression of miRNA targets in Drosophila. (A and B) A published microarray dataset (37) was analyzed for the comparison of the expression levels of the miRNA targets during different periods of Drosophila life cycle. The total number of miRNA targets whose expression level is two times lower than that in 23–24 h embryo (N<1/2×E23–24 h) was divided by the total number of those with expression level two times higher than that in 23–24 h embryo (N>2×E23–24 h). Two sets of Drosophila miRNA targets published by Enright et al. (18) and Stark et al. (18,18,26), respectively were analyzed. As control, the expression levels of the total genes were also analyzed by the same way. E, embryo; L, larva; M, pupae; Am, adult male and Af, adult female. (C) Correlation between the data (N<1/2×E23–24 h/N>2×E23–24 h) obtained using two different miRNA target datasets.
Figure 6
Figure 6
MiRNAs more frequently target ubiquitously expressed genes than tissue-restrictively expressed genes. A microarray dataset published by Zhang et al. (39), which contains 21 622 genes including 2276 miRNA targets (19), was used in this analysis as described in the ‘Materials and Methods’. The ratio of the miRNA target genes to the total genes expressed in an indicated number of tissues was calculated.

References

    1. Ambros V. microRNAs: tiny regulators with great potential. Cell. 2001;107:823–826. - PubMed
    1. Bartel D.P. MicroRNAs: genomics, biogenesis, mechanism, and function. Cell. 2004;116:281–297. - PubMed
    1. Cullen B.R. Transcription and processing of human microRNA precursors. Mol. Cell. 2004;16:861–865. - PubMed
    1. Kim V.N. MicroRNA biogenesis: coordinated cropping and dicing. Nat. Rev. Mol. Cell. Biol. 2005;6:376–385. - PubMed
    1. Carmell M.A., Hannon G.J. RNase III enzymes and the initiation of gene silencing. Nat. Struct. Mol. Biol. 2004;11:214–218. - PubMed

Publication types