. 2007 Feb;143(2):876-92.
doi: 10.1104/pp.106.088708. Epub 2006 Dec 8.

Gradual soil water depletion results in reversible changes of gene expression, protein profiles, ecophysiology, and growth performance in Populus euphratica, a poplar growing in arid regions

Affiliations

Gradual soil water depletion results in reversible changes of gene expression, protein profiles, ecophysiology, and growth performance in Populus euphratica, a poplar growing in arid regions

Marie-Béatrice Bogeat-Triboulot et al. Plant Physiol. 2007 Feb.

Abstract

The responses of Populus euphratica Oliv. plants to soil water deficit were assessed by analyzing gene expression, protein profiles, and several plant performance criteria to understand the acclimation of plants to soil water deficit. Young, vegetatively propagated plants originating from an arid, saline field site were submitted to a gradually increasing water deficit for 4 weeks in a greenhouse and were allowed to recover for 10 d after full reirrigation. Time-dependent changes and intensity of the perturbations induced in shoot and root growth, xylem anatomy, gas exchange, and water status were recorded. The expression profiles of approximately 6,340 genes and of proteins and metabolites (pigments, soluble carbohydrates, and oxidative compounds) were also recorded in mature leaves and in roots (gene expression only) at four stress levels and after recovery. Drought successively induced shoot growth cessation, stomatal closure, moderate increases in oxidative stress-related compounds, loss of CO2 assimilation, and root growth reduction. These effects were almost fully reversible, indicating that acclimation was dominant over injury. The physiological responses were paralleled by fully reversible transcriptional changes, including only 1.5% of the genes on the array. Protein profiles displayed greater changes than transcript levels. Among the identified proteins for which expressed sequence tags were present on the array, no correlation was found between transcript and protein abundance. Acclimation to water deficit involves the regulation of different networks of genes in roots and shoots. Such diverse requirements for protecting and maintaining the function of different plant organs may render plant engineering or breeding toward improved drought tolerance more complex than previously anticipated.


Figures
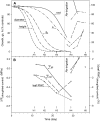
Figure 1.
Figure 1.
Level of physiological functions in drought-stressed P. euphratica (relative to controls) as a function of time. A, Growth (diameter, height, and fine roots), net CO2 assimilation rate (A), and gs were expressed as a percentage of controls. Sigmoidal curves were adjusted to the data (y = 100/[1 + exp {−(xx0)/b}]), and correlation coefficients r2 were 0.90, 0.89, 0.38, 0.78, and 0.95, respectively. B, Ψpd, Ψmd, and RWC were expressed as the difference between drought stressed and controls. Arrows indicate the five harvest dates (H1–H5). Drought-stressed plants were under controlled irrigation until day 29, while the batch of drought-stressed, reirrigated plants were under controlled irrigation until day 26 and then fully reirrigated.
Figure 2.
Figure 2.
Level of physiological functions in drought-stressed P. euphratica (relative to controls) as a function of soil-REW. A, Growth (diameter, height, and fine roots), net CO2 assimilation rate (A), and gs were expressed as percent of controls. Sigmoidal curves were adjusted to the data (y = 100/[1 + exp {−(xx0)/b}]), and correlation coefficients r2 were 0.90, 0.91, 0.38, 0.80, and 0.94, respectively. B, Ψpd, Ψmd, and RWC were expressed as the difference between drought stressed and controls. Arrows indicate the soil-REW reached at the first four harvest dates (H1–H4).
Figure 3.
Figure 3.
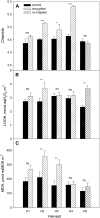
Lumen area of xylem vessels (A) and fibers (B) and fiber cell wall thickness (C) as recorded in stems of P. euphratica during water deficit at the five harvest dates. H1 to H4 correspond to four harvest points with increasing soil water depletion and H5 to the harvest after 10 d of reirrigation. Data were recorded in the youngest 100-μm xylem tissue (close to cambium) on two to four plants per harvest and treatment. Mean ± se; vessels, n = 9 to 95; fibers, n = 22 to 369; cell walls, n = 12 to 60. *, **, and ***, Difference was significant with P < 0.05, P < 0.01, and P < 0.001, respectively; ns, No significant difference.
Figure 4.
Figure 4.
Chlorophyll a-to-chlorophyll b ratio (A), LOOH (B), and MDA (C) content in P. euphratica leaves expressed on a surface area basis at the five harvest dates. H1 to H4 correspond to four harvest dates with increasing soil water depletion and H5 to the harvest after 10 d of reirrigation. *, **, and ***, Difference was significant with P < 0.05, P < 0.01, and P < 0.001, respectively. ns, No significant difference.
Figure 5.
Figure 5.
Correlation between relative concentrations (drought stressed versus controls) of LOOH, MDA, and AlDH transcript levels in leaves of P. euphratica. Log normal peak and exponential decay regression curves were fitted to LOOH and MDA, respectively.
Figure 6.
Figure 6.
Full turgor osmotic pressure generated in P. euphratica leaves by soluble carbohydrates (megaPascal) as computed from concentrations at the five harvest dates. H1 to H4 correspond to four harvest points with increasing soil water depletion and H5 to the harvest after 10 d of reirrigation. ***, Difference was significant with P < 0.001.
Figure 7.
Figure 7.
Differentially expressed transcripts in leaves (A) and roots (B) of P. euphratica during water deficit at the five harvest dates (minimum fold change of 2 and P value of 0.05). H1 to H4 correspond to four harvest dates with increasing soil water depletion and H5 to the harvest after 10 d of reirrigation. The most important clusters of transcriptional changes (A–H) are indicated. See text for details.
Figure 8.
Figure 8.
Number of proteins showing an increased or decreased abundance in P. euphratica leaves during water deficit at four harvest time dates. H1, H2, and H4 correspond to three harvests with increasing soil water depletion and H5 to the harvest after 10 d of reirrigation. NA, Not analyzed.
Figure 9.
Figure 9.
Abundance of SP1 proteins in P. euphratica leaves analyzed by SDS-PAGE analysis with Coomassie Blue staining (A; one representative sample) and by optical densitometry (B) at five harvest dates. H1 to H4 correspond to the four harvest dates with increasing water depletion and H5 to the harvest after 10 d of reirrigation. Values are means ± se (n = 2–4). **, Significant difference at P < 0.01; ns, no significant difference.

References

    1. Aharon R, Shahak Y, Wininger S, Bendov R, Kapulnik Y, Galili G (2003) Overexpression of a plasma membrane aquaporin in transgenic tobacco improves plant vigor under favorable growth conditions but not under drought or salt stress. Plant Cell 15 439–447 - PMC - PubMed
    1. Akashi K, Nishimura N, Ishida Y, Yokota A (2004) Potent hydroxyl radical-scavenging activity of drought-induced type-2 metallothionein in wild watermelon. Biochem Biophys Res Commun 323 72–78 - PubMed
    1. Aussenac G (2000) Interactions between forest stands and microclimate: ecophysiological aspects and consequences for silviculture. Ann Sci 57 287–301
    1. Bartels D, Souer E (2003) Molecular responses of higher plants to dehydration. In H Hirt, K Shinozaki, eds, Topics in Current Genetics: Plant Response to Abiotic Stress, Vol 4. Springer Verlag, Heidelberg, pp 9–38
    1. Bentsink L, Alonso-Blanco C, Vreugdenhil D, Tesnier K, Groot SPC, Koornneef M (2000) Genetic analysis of seed-soluble oligosaccharides in relation to seed storability of Arabidopsis. Plant Physiol 124 1595–1604 - PMC - PubMed

Publication types