. 2006 Dec 1;20(23):3269-82.
doi: 10.1101/gad.1496506.

A dynamic, mitotic-like mechanism for bacterial chromosome segregation

Affiliations

A dynamic, mitotic-like mechanism for bacterial chromosome segregation

Michael A Fogel et al. Genes Dev. .

Abstract

The mechanisms that mediate chromosome segregation in bacteria are poorly understood. Despite evidence of dynamic movement of chromosome regions, to date, mitotic-like mechanisms that act on the bacterial chromosome have not been demonstrated. Here we provide evidence that the Vibrio cholerae ParAI and ParBI proteins are components of an apparatus that pulls the origin region of the large V. cholerae chromosome to the cell pole and anchors it there. ParBI interacts with a conserved origin-proximal, centromere-like site (parSI) that, following chromosome replication, segregates asymmetrically from one pole to the other. While segregating, parSI stretches far away from neighboring chromosomal loci. ParAI forms a dynamic band that extends from the pole to the segregating ParBI/parSI complex. Movement of ParBI/parSI across the cell occurs in concert with ParAI retraction. Deletion of parAI disrupts proper origin localization and segregation dynamics, and parSI no longer separates from nearby regions. These data suggest that ParAI forms a dynamic structure that pulls the ParBI-bound chromosome to the pole in a process analogous to anaphase of eukaryotic mitosis.


Figures

Figure 1.
Figure 1.
YFP-ParBI localization and segregation in wild-type and ΔparAI cells. Wild-type (A–E) and ΔparAI V. cholerae (F–J) strains containing pMF302 encoding YFP-ParBI were analyzed. (A,F) Representative fields. (B,G) The four most common subcellular localization patterns for YFP-ParBI accounting for ∼95% of cells with detectable foci are shown. (C,H) Automated analysis of YFP-ParBI foci positions in wild-type (WT) and ΔparAI cells with two foci. The focus closest to a pole in each cell is represented with blue squares, and the more distant focus with orange squares. The dashed line shows the mean position of the closest-to-pole focus. (D,I) Histogram of the distances of closest-to-pole foci from the data in C and H, respectively, binned into 10 groups. (E,J) Representative time-lapse sequences (time in minutes). Bar, 1 μm.
Figure 2.
Figure 2.
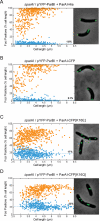
Automated analysis of YFP-ParBI foci positions in ΔparAI cells expressing different ParAI variants. The positions of the foci in cells containing exactly two YFP-ParBI foci were analyzed by software that determines the position of each focus in the cell. The distributions of YFP-ParBI foci positions in ΔparAI + ParAI-His (n = 443) (A), ΔparAI + ParAI-CFP (n = 277) (B), ΔparAI + ParAI-CFP[K16E] (n = 487) (C), and ΔparAI + ParAI-CFP[K16Q] (n = 389) (D). The dashed line shows the mean position of the closest-to-pole focus. Representative cells of each type are shown adjacent to each graph.
Figure 3.
Figure 3.
Separation of parSI from a neighboring chromosomal locus. (A) Diagram of chrI of V. cholerae and the relative locations of tetO(1) (−90 kb) and tetO(2) (+15 kb) sites (red bars) as well as the parSI region (+65 kb, green bar), which contains the three ParBI-binding sites. The location of the parAI and parBI genes (purple arrows) and the origin region (orange box) are also represented. Strains YBB025 (wild-type, WT) and MF302 (ΔparAI) contain the tetO cassette integrated at tetO(2) and the plasmid pMF310 that expresses CFP-ParBI (pseudo-colored green) and TetR-YFP (red). (B,E) Representative YBB025 and MF302 cells of different sizes. The white arrowhead shows a cell with two CFP-ParBI foci and one TetR-YFP focus. The white double-headed arrow shows a cell with ∼1 μm of space between CFP-ParBI and TetR-YFP foci. The closely associated foci at the (presumed) old pole are marked with a single white star, and segregating pairs of foci are marked with double white stars. (C,F) Automated analysis of the positions of the CFP-ParBI foci pairs (green circles and squares) and TetR-YFP foci pairs (red circles and squares) in YBB025 (n = 240) (B) and MF302 (n = 240) (E). (D) Histogram of the distribution of interfocal distances between segregating pairs of TetR-YFP and CFP-ParBI foci for YBB025 (orange bars), and for MF302 (blue bars); each set of distances was grouped into 10 equal-sized bins. Bar, 1.0 μm.
Figure 4.
Figure 4.
ParAI-CFP localization is dynamic and asymmetric. ΔparAI cells carrying plasmids expressing ParAI-CFP were analyzed. (A, panels I–III) Representative cells are shown with the frequencies of the three major patterns of ParAI-CFP localization. (B) Deconvolution of the fluorescence signal from ParAI-CFP (top) and ParAI-CFP[K16E] (bottom). Z-stacks were taken with 0.1-μm steps, and two adjacent sections from the raw and deconvoluted stacks are shown for both. For ParAI-CFP, the deconvoluted z-sections were pseudo-colored green and red and merged. (C) A representative time-lapse sequence of ParAI-CFP localization; the time in minutes is shown for each image. Bar, 1.0 μm.
Figure 5.
Figure 5.
YFP-ParBI colocalizes with ParAI-CFP at the pole and at the edge of ParAI-CFP bands. ΔparAI cells contained plasmids expressing YFP-ParBI and ParAI-CFP. (A) Phase, YFP, CFP, and merged images of a representative cell showing the two distinct types of colocalization: foci at the pole (white arrowhead) and YFP-ParBI-focus at the edge of ParAI-CFP bands (white star). (B) Representative cells of different lengths and at different points during chromosome segregation showing the relationship of ParAI-CFP localization with YFP-ParBI. (C) Graphical representation of the relationship between YFP-ParBI separation (green circles) and the localization of ParAI-CFP fluorescence along the cell’s length (red surface) in 314 cells. For each cell, width-averaged ParAI-CFP fluorescence (Z-axis) at each point along the midline (X-axis) is graphed versus the distance between the YFP-ParBI foci of that cell. The positions of the YFP-ParBI foci (green) are overlaid on the graph (at an arbitrary Z-axis height of 0.3 for visibility). Dashed arrows point to images of cells (panels a–d) representative of data at the indicated position of the graph. The width-averaged ParAI-CFP fluorescence values were background-subtracted, then normalized as a fraction of total cellular fluorescence. The positions along the midline (X-axis) and the distance between YFP-ParBI foci (Y-axis) were normalized as a fraction of total cell length. Only cells with above-background signal for both fusions and wild-type localization of the YFP-ParBI foci were analyzed. (D) Time-lapse analysis of ΔparAI cells expressing ParAI-CFP and YFP-ParBI showing that ParAI-CFP retracts toward the new pole ahead of segregating YFP-ParBI foci. Bar, 1.0 μm.
Figure 6.
Figure 6.
Mutations in the conserved ATPase domain of ParAI abolish ParAI-CFP localization. (A) Representative images of ΔparAI cells expressing wild-type ParAI-CFP (top), ParAI-CFP [K16E] (middle), and ParAI-CFP [K16Q] (bottom). (B) Phase, YFP, CFP, and merged images of a representative cell expressing both YFP-ParBI and ParAI-CFP[K16Q] showing their colocalization. Bar, 1.0 μm.
Figure 7.
Figure 7.
Model of ParAI-mediated segregation of the ParBI-bound origin of chrI. (A) Older, predivisional, cells contain two fully replicated and segregated chromosomes. The origin of each chromosome is attached to the pole by an interaction between ParAI, anchored to an as-of-yet unknown polar protein/structure, and ParBI, bound to the chromosome at the origin-proximal parSI site. (B) At some point, perhaps related to the assembly of the cell division machinery, ParAI nucleates at the forming septum and polymerizes outward as bands or networks of polymers toward both poles. The next round of DNA replication yields sister copies of the origin region, each containing a ParBI–parSI complex. One complex is captured by the ParAI already present at the old pole; the other ParB–parSI complex is captured by the ParAI extending from the closing septum that will become the new pole. (C,D) The completion of cytokinesis produces two daughter cells in which ParBI-bound DNA is being pulled across the cell by the retracting ParAI polymers.

References

    1. Adachi, S., Hori, K., Hiraga, S. Subcellular positioning of F plasmid mediated by dynamic localization of SopA and SopB. J. Mol. Biol. 2006;356:850–863. - PubMed
    1. Barillà, D., Rosenberg, M.F., Nobbmann, U., Hayes, F. Bacterial DNA segregation dynamics mediated by the polymerizing protein ParF. EMBO J. 2005;24:1453–1464. - PMC - PubMed
    1. Donnenberg, M.S., Kaper, J.B. Construction of an eae deletion mutant of enteropathogenic Escherichia coli by using a positive-selection suicide vector. Infect. Immun. 1991;59:4310–4317. - PMC - PubMed
    1. Dworkin, J., Losick, R. Does RNA polymerase help drive chromosome segregation in bacteria? Proc. Natl. Acad. Sci. 2002;99:14089–14094. - PMC - PubMed
    1. Ebersbach, G., Gerdes, K. The double par locus of virulence factor pB171: DNA segregation is correlated with oscillation of ParA. Proc. Natl. Acad. Sci. 2001;98:15078–15083. - PMC - PubMed

Publication types

LinkOut - more resources