. 2006 Dec 1;20(23):3324-36.
doi: 10.1101/gad.396106.

The histone variant mH2A1.1 interferes with transcription by down-regulating PARP-1 enzymatic activity

Affiliations

The histone variant mH2A1.1 interferes with transcription by down-regulating PARP-1 enzymatic activity

Khalid Ouararhni et al. Genes Dev. .

Abstract

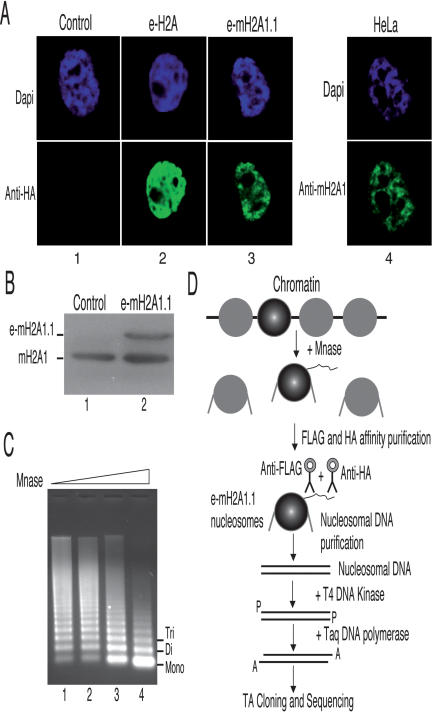
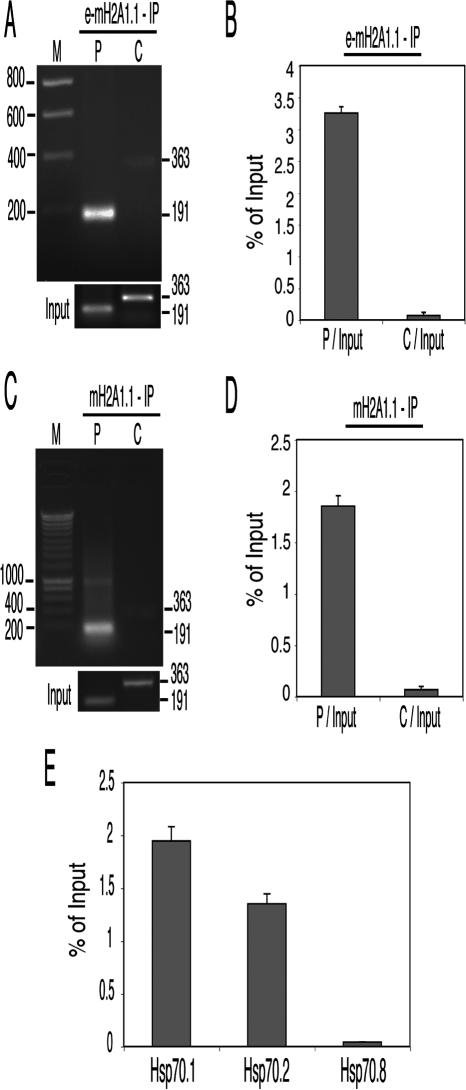
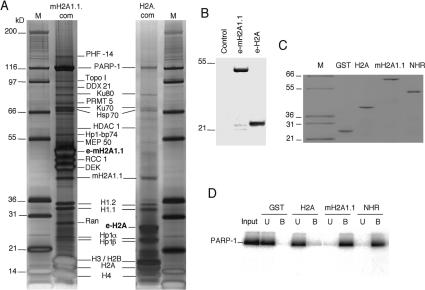
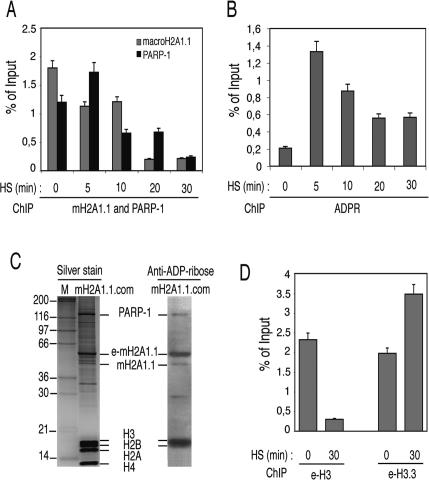
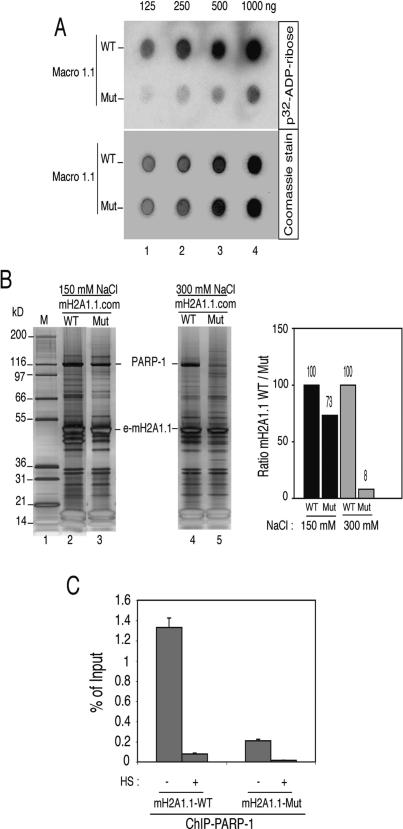
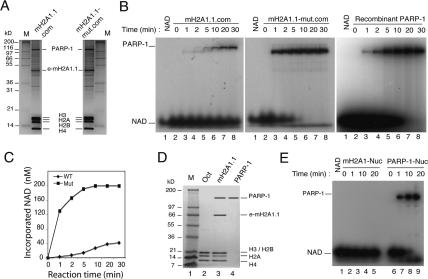
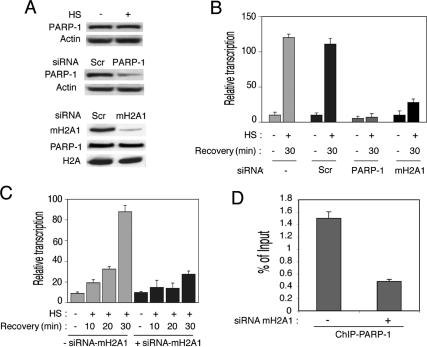
The histone variant mH2A is believed to be involved in transcriptional repression, but how it exerts its function remains elusive. By using chromatin immunoprecipitation and tandem affinity immunopurification of the mH2A1.1 nucleosome complex, we identified numerous genes with promoters containing mH2A1.1 nucleosomes. In particular, the promoters of the inducible Hsp70.1 and Hsp70.2 genes, but not that of the constitutively expressed Hsp70.8, were highly enriched in mH2A1.1. PARP-1 was identified as a part of the mH2A1.1 nucleosome complex and was found to be associated with the Hsp70.1 promoter. A specific interaction between mH2A1.1 and PARP-1 was demonstrated and found to be associated with inactivation of PARP-1 enzymatic activity. Heat shock released both mH2A1.1 and PARP-1 from the Hsp70.1 promoter and activated PARP-1 automodification activity. The data we present point to a novel mechanism for control of Hsp70.1 gene transcription. mH2A1.1 recruits PARP-1 to the promoter, thereby inactivating it. Upon heat shock, the Hsp70.1 promoter-bound PARP-1 is released to activate transcription through ADP-ribosylation of other Hsp70.1 promoter-bound proteins.


Figures

Figure 1.
Figure 1.
Preparation and purification of e-mH2A1.1 nucleosomes. (A) e-mH2A1.1 associates with chromatin. HeLa cell lines stably expressing either e-H2A (column 2) or e-mH2A1.1 (column 3) were stained with DAPI (top) and anti-HA antibody (bottom). (Column 4) Control HeLa cell line stained with DAPI (top) and anti-macroH2A1 antibody (bottom). (B) Western blot quantification of e-mH2A1.1 expression level in HeLa cells. Total extracts isolated from HeLa cells expressing e-mH2A1.1 or not were resolved by SDS-PAGE, blotted, and revealed with anti-macroH2A1 antibody. (C) Preparation of e-mH2A1.1 nucleosomes. Nuclei from a HeLa cell line stably expressing an epitope-tagged version of mH2A1.1 were digested with increasing amounts of micrococcal nuclease; the DNA from the digested samples was purified and resolved in 1% agarose gel. (D) Schematics of the TAP-ChIP approach used for the purification of e-mH2A1.1 nucleosomes and identification of the DNA sequences associated with e-mH2A1.1.
Figure 2.
Figure 2.
mH2A1.1 is associated with the Hsp70.1 and Hsp70.2, but not with the Hsp70.8 promoter. (A) Analysis of e-mH2A1.1 distribution on the Hsp70.1 locus using semiquantitative PCR. Mono- and dinucleosomes were purified from HeLa cells stably expressing tagged macro-H2A1.1 histone by TAP as described in Figure 1D. Input DNA and DNA isolated from the immunoprecipitated samples were amplified by PCR with Hsp70.1 promoter (P) and coding (C) region primers, and the amplified products were separated on a 2% agarose gel. Molecular masses of the amplification products are indicated on the right side of the figure. Lane M corresponds to a molecular ladder. The panel “Input” (lower part of the figure) shows the fragments amplified from the input fraction (the starting material before immunoprecipitation) with primers specific for the promoter (P) and the coding (C) sequence. (B) e-mH2A1.1 is associated exclusively with the promoter region of the Hsp70.1 gene. Nucleosomes were isolated from a HeLa cell line stably expressing e-mH2A1.1. Input DNA and the DNA isolated from tandem-immunoaffinity-purified e-mH2A1.1 nucleosomes were amplified by real-time PCR. The histograms show the relative enrichment of e-mH2A1.1 on the promoter (P/Input) and the coding region (C/Input) versus the input DNA. (C) Distribution of endogenous mH2A1 on the Hsp70.1 locus using semiquantitative PCR. Nucleosomes were isolated from a control HeLa cell line (not expressing e-mH2A1.1), and the particles associated with the endogenous mH2A1 were immunoprecipitated with an anti-mH2A1 antibody. The input and the DNA isolated from the immunoprecipitated samples were amplified by semiquantitative PCR using the same primers as in A. The amplified products were separated on a 2% agarose gel. Molecular masses of the PCR-amplified fragments are indicated on the right side of the figure. Lane M corresponds to a molecular ladder. At the lower part of the figure (panel “Input”) are shown the fragments amplified from the input material by using primers specific for the promoter (P) and coding (C) sequences. (D) Quantitative real-time PCR of the DNA isolated from the immunoprecipitated nucleosomes with anti-mH2A1 antibody. Nucleosomes were isolated from control HeLa cells and immunoprecipitated with anti-mH2A1 antibody. The DNA isolated from the nucleosomes was amplified by using real-time PCR as described in B. Histograms show the amount of immunoprecipitated DNA as a function of percent input DNA. (E) The promoter regions of the inducible Hsp70.1 and Hsp70.2, but not that of the constitutively expressed Hsp70.8 gene, are highly enriched in mH2A.1. DNA isolated from the nucleosomes immunoprecipitated with the anti-mH2A1 antibody was quantitatively amplified by real-time PCR using primers specific for the promoters of Hsp70.1, Hsp70.2, and Hsp70.8 genes, respectively. Histograms show the amount of DNA immunoprecipitated as a function of percent input DNA.
Figure 3.
Figure 3.
Characterization of H2A and mH2A1.1 complexes. (A) Silver staining of the e-H2A (H2A.com) and e-mH2A1.1 (mH2A1.1.com) nucleosome complexes isolated from HeLa cell lines stably expressing either e-H2A or e-mH2A1.1 proteins. The polypeptides identified by mass spectrometric analyses are indicated. Lane M corresponds to a protein molecular weight marker. The molecular masses of the markers are indicated on the left. (B) Western blot analysis of HeLa cells expressing e-mH2A1.1 and e-H2A. Total extracts isolated from control HeLa cells (control), stable HeLa cells expressing e-mH2A1.1 (e-mH2A1.1), and stable HeLa cells expressing e-H2A (e-H2A) were resolved by SDS-PAGE, blotted, and revealed with anti-Flag antibody. The molecular masses of the protein mass markers are indicated on the left. (C) Purification of recombinant GST-histones. Recombinant GST (GST), GST-H2A (H2A), GST-mH2A1.1 (mH2A1.1), or GST-NHR (NHR) were produced in bacteria and purified on glutathione Sepharose 4B (Amersham) according to the manufacturer’s instructions. The samples were quantified, run on a 12% SDS-PAGE gel, and stained with Coomassie blue. (Lane M) Protein molecular mass marker. (D) GST pull-down experiment. Human recombinant PARP-1 was incubated with either recombinant GST (GST), GST-H2A (H2A), GST-mH2A1.1 (mH2A1.1), or GST-NHR (NHR). Beads were washed, and unbound (U) and bead-bound proteins (B) were run on a 12% SDS-PAGE gel, blotted, and revealed with anti-PARP-1 antibody.
Figure 4.
Figure 4.
ChIP analysis reveals a dynamic protein exchange and a dramatic increase of protein ADP-ribosylation of the Hsp70.1 promoter upon heat-shock activation. Distinct HeLa cell lines stably expressing Flag-HA-tagged versions of either mH2A1.1, or H3 or H3.3 histones were used in the experiments. A nontagged HeLa cell line was used as a negative control. (A) Time course of the heat-shock-induced displacement of mH2A1.1 and PARP-1 from the Hsp70.1 promoter. The cells were heat-shocked for the times indicated and then immediately treated with formaldehyde to cross-link the proteins to DNA. ChIP was carried out by using either anti-Flag or anti-PARP-1 antibodies. The DNA isolated from the immunoprecipitated samples was amplified by real-time PCR. The histograms show the amount of Hsp70.1 immunoprecipitated promoter DNA as a percent of the input DNA. The means and standard deviations of three independent experiments are presented. (B) Time course of the ADP-ribosylation of the proteins associated with the Hsp70.1 promoter upon heat shock. The experiment was carried out as in A, but using anti-ADP-ribose antibody. The amounts of ADP-ribose on the Hsp70.1 promoter at the indicated times after the heat shock are presented as copy numbers of the PCR-amplified products. The means and standard deviations of three independent experiments are presented. (C) mH2A1.1 is ADP-ribosylated. (Left panel) The e-mH2A1.1 complex was isolated from stable HeLa cell lines, separated on a 12% PAGE containing SDS, and silver-stained. The first lane shows the molecular markers with the molecular masses indicated at left. The right panel shows the Western blot of the complex revealed by anti-ADP-ribose antibody. Note that e-mH2A1.1, H3, and H2B are heavily ADP-ribosylated. PARP-1 is also found to be ADP-ribosylated, but to a lesser extent. (D) Removal of histone H3 and replacement with H3.3 at the Hsp70.1 promoter upon heat shock. The ChIP experiments were carried out as described in A by using anti-Flag antibody and cells expressing either epitope-tagged H3 (e-H3) or epitope-tagged H3.3 (e-H3.3). The DNA isolated from the immunoprecipitated samples was amplified by real-time PCR. The histograms show the amount of Hsp70.1 promoter DNA immunoprecipitated before (0 min) and after 30 min of heat shock as a percent of input DNA. The means and standard deviations of three independent experiments are given.
Figure 5.
Figure 5.
Weaker binding of PARP-1 within the mutated mH2A1.1 nucleosome complex. (A) Altered binding of mono-ADP-ribose to the mutated mH2A1.1. Recombinant wild-type (WT) and mutated (Mut) mH2A1.1 were purified to homogeneity. Increasing amounts of both proteins were loaded (in duplicate) on filters. One filter was then incubated with 32P-ADP-ribose (upper panel), whereas the other one was stained with Coommassie blue as a control for equal loading (lower panel). Note that the binding of the 32P-ADP-ribose to the mutated mH2A1.1 was much weaker compared with that for the wild-type protein. (B) Increasing the ionic strength releases the mutated, but not the wild-type, e-mH2A1.1 protein from the nucleosome complex. The wild-type (WT) and mutated (Mut) mH2A1.1 nucleosome complexes were isolated from cell lines stably expressing the WT or the mutated e-mH2A1.1 histone using either 150 mM NaCl (left panel) or 300 mM NaCl (right panel). The complexes were run on a 4%–12% PAGE gradient containing SDS, then silver-stained. The positions of e-mH2A1.1 and PARP-1 are indicated. (M) Protein molecular mass marker. The right panel presents the quantification of PARP-1 (relative to histone H1) within the WT and mutated e-mH2A1.1 complexes, isolated in 150 mM and 300 mM NaCl, respectively. Note the drastic decrease of the amount of PARP-1 within the mutated mH2A1.1 complex isolated at 300 mM NaCl. (C) The amount of PARP-1 associated in vivo with the Hsp70.1 promoter in the stable cell lines expressing mutated e-mH2A1.1 is much lower compared with that associated with the Hsp70.1 promoter in the stable cell lines expressing WT e-mH2A1.1. Non-heat-shocked (HS; −) and heat-shocked (for 30 min at 42°C) (HS; +) cell lines were treated with formaldehyde to cross-link the proteins to DNA, and ChIP was carried out using anti-PARP-1 antibody. Amounts of the real-time PCR-amplified Hsp70.1 promoter DNA fragments are presented as a percent of input DNA. Note the strong decrease of the amount of PARP-1 associated with the Hsp70.1 promoter of the control cells expressing the mutated e-mH2A1.1, compared with that of the control cells expressing the WT protein.
Figure 6.
Figure 6.
mH2A1.1 down-regulates PARP-1 enzymatic activity. (A) Silver staining of the purified wild-type macroH2A1.1 (e-mH2A1.1) and the mutant (e-mH2A1.1-mut) nucleosomes used for measurement of PARP-1 enzymatic activity. The complexes were isolated using 100 mM NaCl. The bands corresponding to PARP-1, e-mH2A1.1, and the conventional core histones are indicated. (M) Protein molecular mass marker. (B) Kinetic analysis of PARP-1 activity of purified mH2A1.1 complex (left panel), purified mH2A1.1 mutant complex (middle panel), and recombinant PARP-1 (right panel) in the presence of 200 nM 32P-NAD+. To measure the auto-ADP-ribosylation activity of the recombinant PARP-1, an amount of nucleosomes (100 ng) and recombinant PARP-1 equal to that in the mH2A1.1 complexes was used. Note the close auto-ADP-ribosylation kinetics of the recombinant PARP-1 and the PARP-1 in the mH2A1.1-mut.com. (C) Quantification of the data shown in B. Note the dramatic difference in the auto-ADP-ribosylation kinetics of PARP-1 associated with the wild-type and the mutated mH2A1.1 complexes. (D) Twelve percent SDS-PAGE of the purified e-mH2A1.1 octamers and associated PARP-1. e-mH2A1.1 nucleosome complexes were loaded on a hydroxyl apatite column, and after washing with 0.65 M NaCl the remaining proteins were eluted with 2 M buffered solution of NaCl. To purify PARP-1 from the histone octamers, the 2 M NaCl eluate was supplemented with 1 M urea and passed through an agarose-nickel column. (Lanes 1,2) Molecular mass marker and conventional histone octamer as a control. (Lane 3) Tthe protein composition of the 2 M NaCl eluate. (Lane 4) The purified PARP-1. (E) Kinetic analysis of PARP-1 activity associated with in vitro reconstituted nucleosomes containing either conventional core histones (lanes 25) or purified e-mH2A1.1 core histones (lanes 69). The samples were incubated with 32P-NAD+ and run on 12% PAGE containing SDS. Lane 1 contains 32P-NAD+ only.
Figure 7.
Figure 7.
siRNA knockdown of the expression of mH2A1.1 or PARP-1 delays the heat-shock response. (A) The siRNA treatment efficiently suppresses the expression of mH2A1 and PARP-1. HeLa cells were transfected with siRNA specific for either PARP-1 or mH2A.1, or with scrambled siRNA. Forty-eight hours post-transfection the cells were heat-shocked; after a recovery of 30 min, they were collected and lysed. PARP-1 (middle panel) and mH2A.1 (lower panel) were detected by Western blotting using specific antibodies. Immunodetection of actin and H2A was used as control for equal loading. (Lower panel) The level of PARP-1 expression was checked before and after macroH2A1 knock-down. The upper panel shows the amount of PARP-1 before and after heat shock (HS). Note the strong and specific suppression of both PARP-1 and mH2A1 in cells treated with the respective siRNA. (B) Inhibition of mH2A1.1 and PARP-1 expression by siRNA affects the heat-shock response in a similar way. HeLa cells were transfected or not with either macroH2A1-specific siRNA (mH2A1), PARP-1-specific siRNA (PARP-1), or unrelated siRNA (Scr, scrambled). After the heat shock the cells were allowed to recover for 30 min, and RNA was isolated from the different samples. The real-time PCR quantification of the relative amount of Hsp70.1 mRNA versus GAPDH mRNA in HeLa cells before (HS; −) and after (HS; +) a heat shock is shown. Each histogram presents the mean and standard deviation of three independent experiments. (C) Kinetic analysis of Hsp70.1 activation in knocked-down mH2A1.1 HeLa cells. The cells were transfected with mH2A1-specific siRNA (+siRNA-mH2A1) or without any siRNA (−siRNA-mH2A1), and RNA was isolated at 10, 20, or 30 min after the heat shock (HS; +) or in the absence of any heat shock (HS; −). Each histogram is the measured (by real-time PCR) relative amount of Hsp70.1 mRNA versus GAPDH mRNA at the indicated times before (HS; −) or after (HS; +) a heat shock. The means and standard deviations of three independent experiments are presented. (D) Suppression of the expression of mH2A1 with siRNA down-regulates the amount of PARP-1 associated with the Hsp70.1 promoter. Control nontreated (−siRNA-mH2A1) and siRNA-treated (+siRNA-mH2A1) HeLa cells were cross-linked with formaldehyde and used for ChIP with anti-PARP-1 antibody. DNA was isolated from both ChIP samples and submitted to real-time PCR amplification with primers specific for the Hsp70.1 promoter.

References

    1. Abbott, D.W., Chadwick, B.P., Thambirajah, A.A., Ausio, J. Beyond the Xi: MacroH2A chromatin distribution and post-translational modification in an avian system. J. Biol. Chem. 2005;280:16437–16445. - PubMed
    1. Allen, M.D., Buckle, A.M., Cordell, S.C., Lowe, J., Bycroft, M. The crystal structure of AF1521 a protein from Archaeoglobus fulgidus with homology to the non-histone domain of macroH2A. J. Mol. Biol. 2003;330:503–511. - PubMed
    1. Ame, J.C., Spenlehauer, C., de Murcia, G. The PARP superfamily. Bioessays. 2004;26:882–893. - PubMed
    1. Angelov, D., Molla, A., Perche, P.Y., Hans, F., Cote, J., Khochbin, S., Bouvet, P., Dimitrov, S. The histone variant macroH2A interferes with transcription factor binding and SWI/SNF nucleosome remodeling. Mol. Cell. 2003;11:1033–1041. - PubMed
    1. Chadwick, B.P., Willard, H.F. Histone H2A variants and the inactive X chromosome: Identification of a second macroH2A variant. Hum. Mol. Genet. 2001;10:1101–1113. - PubMed

Publication types

MeSH terms

LinkOut - more resources