. 2006 Dec 25;203(13):2907-17.
doi: 10.1084/jem.20061232. Epub 2006 Dec 11.

Neutrophil histamine contributes to inflammation in mycoplasma pneumonia

Affiliations

Neutrophil histamine contributes to inflammation in mycoplasma pneumonia

Xiang Xu et al. J Exp Med. .

Abstract

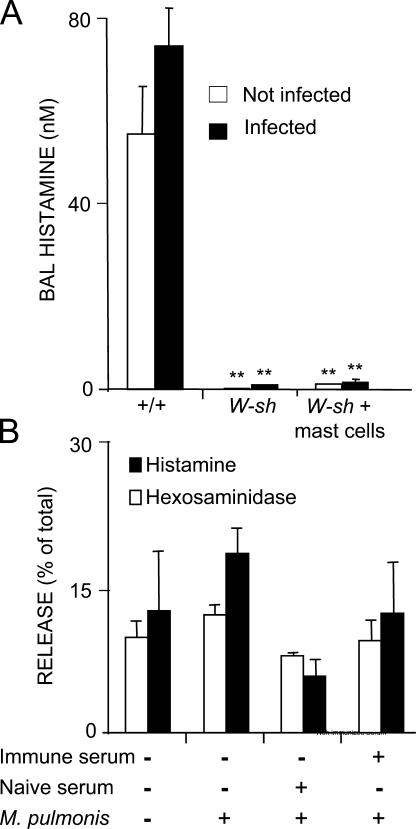
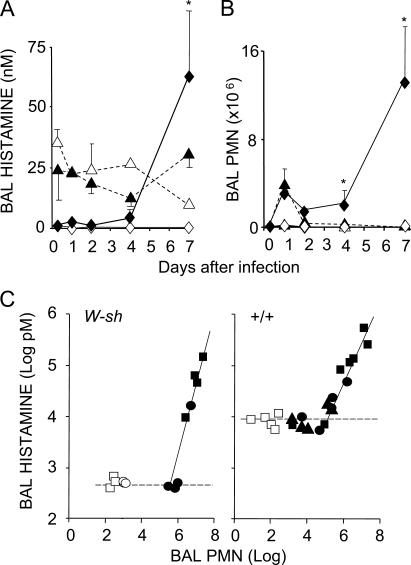
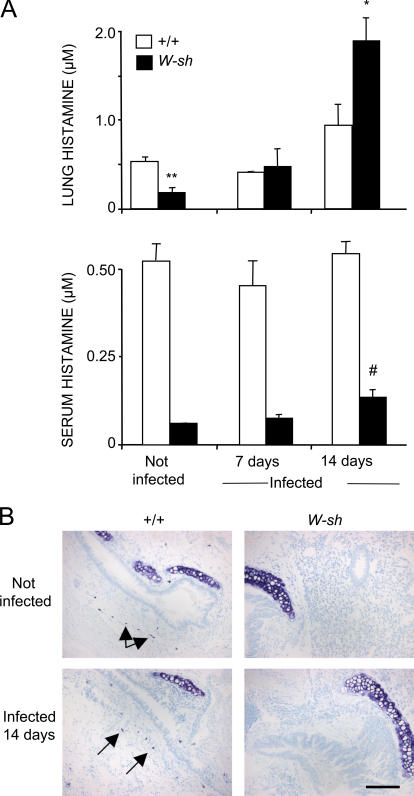
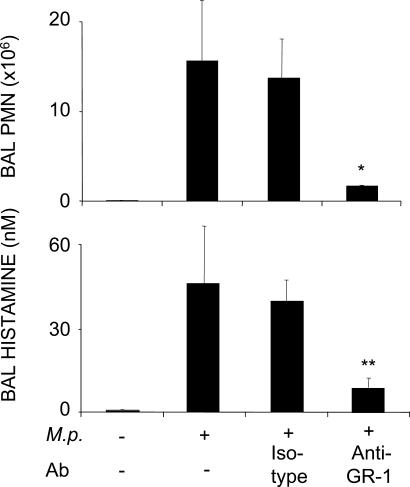
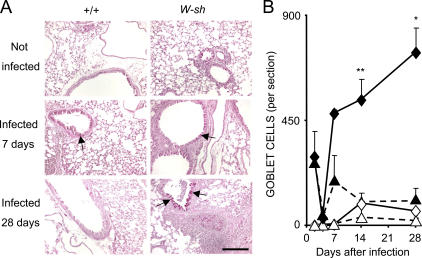
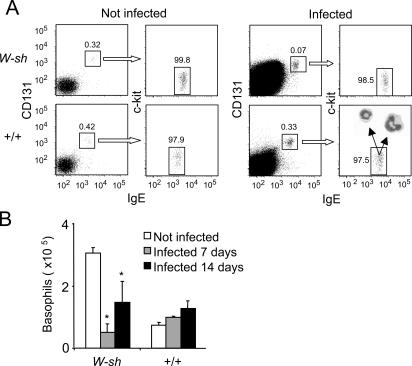
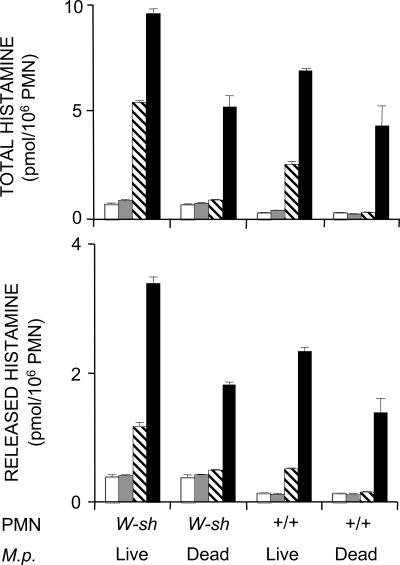
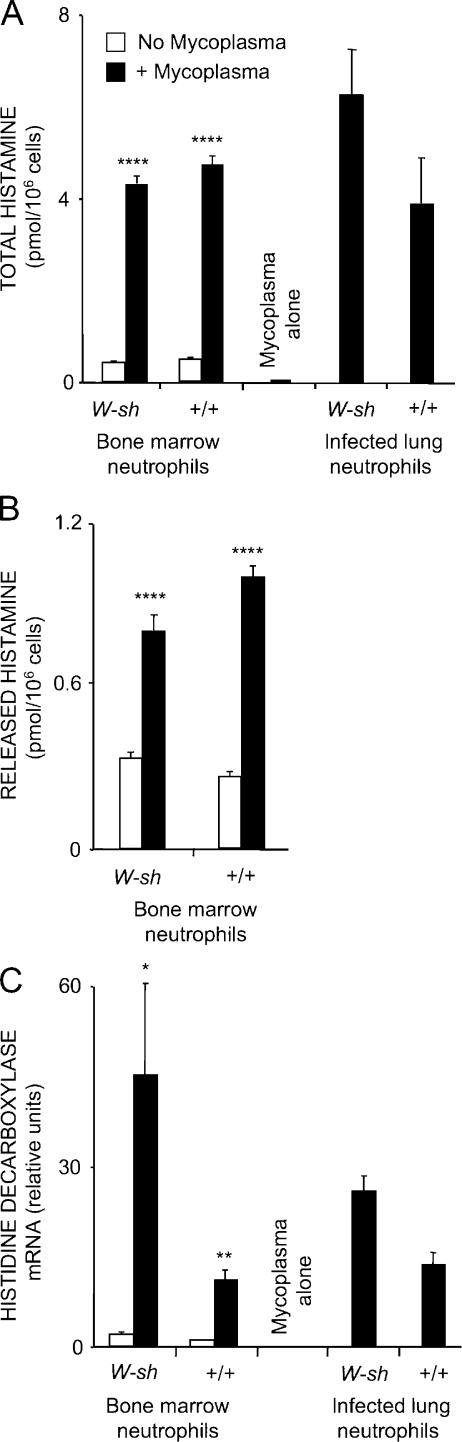
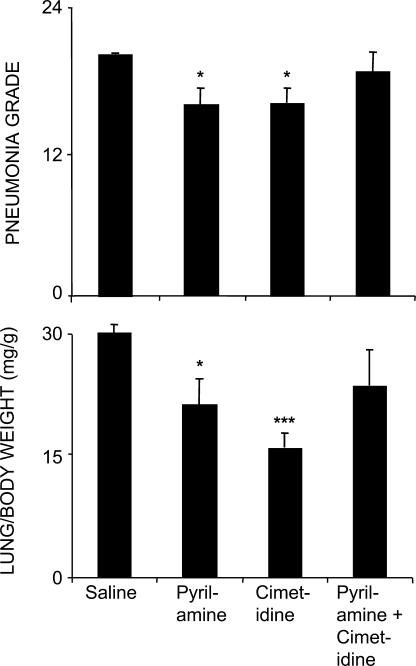
Mycoplasmas cause chronic inflammation and are implicated in asthma. Mast cells defend against mycoplasma infection and worsen allergic inflammation, which is mediated partly by histamine. To address the hypothesis that mycoplasma provokes histamine release, we exposed mice to Mycoplasma pulmonis, comparing responses in wild-type and mast cell-deficient KitW-sh/KitW-sh (W-sh) mice. Low histamine levels in uninfected W-sh mice confirmed the conventional wisdom that mast cells are principal sources of airway and serum histamine. Although mycoplasma did not release histamine acutely in wild-type airways, levels rose up to 50-fold above baseline 1 week after infection in mice heavily burdened with neutrophils. Surprisingly, histamine levels also rose profoundly in infected W-sh lungs, increasing in parallel with neutrophils and declining with neutrophil depletion. Furthermore, neutrophils from infected airway were highly enriched in histamine compared with naive neutrophils. In vitro, mycoplasma directly stimulated histamine production by naive neutrophils and strongly upregulated mRNA encoding histidine decarboxylase, the rate-limiting enzyme in histamine synthesis. In vivo, treatment with antihistamines pyrilamine or cimetidine decreased lung weight and severity of pneumonia and tracheobronchitis in infected W-sh mice. These findings suggest that neutrophils, provoked by mycoplasma, greatly expand their capacity to synthesize histamine, thereby contributing to lung and airway inflammation.


Figures

Figure 1.
Figure 1.
Mycoplasma does not induce acute release of mast cell histamine. (A) Histamine levels in BAL supernatants were determined 2 h after airway infection with M. pulmonis in +/+ and mast cell–deficient W-sh mice and in W-sh mice with a super-normal population of intrapulmonary mast cells established by adoptive transfer of +/+ BMMCs. “Not infected” mice were sham infected with sterile broth. Data are mean ± SE; n = 3–6 animals per group; **, P < 0.01 in comparison with +/+ groups. There were no significant differences between infected and sham-infected results in a given type of mouse. (B) Release of histamine and the secretory granule marker, β-hexosaminidase, was measured in BMMCs. Cells were exposed to serum from mice with high titers of M. pulmonis–specific Ig (immune serum), to serum from mice never exposed to mycoplasma (naive serum), and to live M. pulmonis in combinations as shown. Control cells were incubated in Tyrode's buffer. Data are mean ± SE; n = 3. There were no significant differences between groups.
Figure 2.
Figure 2.
BAL histamine correlates with PMN levels. BAL histamine (A) and total PMNs (B) were determined up to 7 d after infection in W-sh and +/+ mice and compared with results in sham-infected mice. Closed diamonds, open diamonds, closed triangles, and open triangles represent data from W-sh–infected, W-sh sham-infected, +/+ infected and +/+ sham-infected mice, respectively. Data are mean ± SE; n = 3–6 animals per group; *, P < 0.05 in comparison with sham-infected W-sh values at all time points. In C, concentration of BAL histamine is plotted against total PMNs. Each data point derives from a single BAL sample in a single W-sh (left) or +/+ (right) mouse. In the W-sh panel, open circles and squares depict samples from mice 4 and 7 d, respectively, after sham infection. Closed circles and squares represent samples from mice 4 and 7 d, respectively, after infection with 0.5 × 10⁶ CFU of M. pulmonis. In the +/+ panel, open squares represent samples obtained 7 d after sham infection. Closed triangles, circles, and squares represent samples obtained 7 d after infection with 0.5 × 10⁶, 1.0 × 10⁶, and 2.0 × 10⁶ CFU, respectively, of M. pulmonis. Dotted lines depict approximate baseline histamine concentrations. The intersection of the solid and dotted line identifies the approximate threshold number of BAL neutrophils in an infected mouse needed to generate a detectable rise in histamine above baseline.
Figure 3.
Figure 3.
Increases in lung and serum histamine levels in mycoplasma-infected W-sh mice are not caused by induction of mast cells. (A) The top graph compares histamine concentrations in lung homogenates of uninfected +/+ and mast cell–deficient W-sh mice with those in the same types of mice 7 and 14 d after infection with M. pulmonis. The bottom graph compares levels of serum histamine in the same groups of mice. Data are mean ± SE; n = 4–6 animals per group; *, P < 0.05 in comparison with +/+ mice infected 14 d; **, P < 0.01 in comparison with +/+ mice not infected; #, P = 0.05 in comparison with W-sh mice not infected. (B) These representative micrographs compare toluidine blue–stained lung and airway sections in sham- and mycoplasma-infected +/+ and W-sh mice. Arrows indicate some of the metachromatically staining mast cells in +/+ sections. Bar, 135 μM.
Figure 4.
Figure 4.
Anti-PMN antibodies decrease BAL PMNs and histamine levels proportionately in mycoplasma-infected, mast cell–deficient mice. W-sh mice were injected with control (Isotype) or PMN-directed anti–GR-1 mAb 5 d after infection with M. pulmonis (M.p.). Levels of PMN and histamine in BAL were determined 2 d after mAb injection. “Uninfected” mice were sham-infected. Data are mean ± SE; n = 3–4 animals per group; *, P < 0.05 and **, P < 0.01 compared with isotype control groups.
Figure 5.
Figure 5.
Neutrophilic tracheobronchitis is associated with airway epithelial remodeling in mycoplasma-infected mice. (A) These representative micrographs of periodic acid–Schiff and hematoxylin-stained airway sections compare histopathology in +/+ and W-sh mice Bar, 180 μM. Infected W-sh mice developed more severe and persistent neutrophilic inflammation accompanied by goblet cell hyperplasia, as reflected by increased numbers of periodic acid–Schiff–positive airway epithelial cells (arrows). Control mice were sham infected with saline 7 d before harvest. (B) Airway goblet cell numbers were quantitated in tissue sections from mycoplasma- and sham-infected mice. Symbols represent the following: closed diamonds, mycoplasma-infected W-sh; closed triangles, mycoplasma-infected +/+; open diamonds, sham-infected W-sh; open triangles, sham-infected +/+. Data are mean ± SE; n = 4–5 animals per group; *, P < 0.05 and **, P < 0.01 compared with infected +/+.
Figure 6.
Figure 6.
Flow cytometry reveals that changes in basophil numbers do not account for increases in histamine in mycoplasma-infected mice. (A) These representative plots compare surface expression of CD131 (β chain common to receptors for IL-3, IL-5, and GM-CSF), IgE, and c-kit in lung cells from +/+ and W-sh mice. These data are from mice studied 14 d after sham or mycoplasma infection. The percentage of cells in specific gates (boxed) is indicated. Basophils are CD131 and IgE positive but express little or no c-kit, distinguishing them from mast cells. In lungs from all types of mice, the CD131+/IgE+ subset (gated as noted) was a small but distinct population of extractable cells, consisting almost entirely of c-kit and c-kitlo cells. As shown in the lower right panel inset, these cells feature basophilic granules with segmented nuclei. (B) The number of basophils per lung 7 and 14 d after infection was calculated by multiplying total cells by the fraction of CD131+/IgE+ cells. Data are mean ± SE; n = 3 animals per group; *, P < 0.05 in comparison with uninfected W-sh.
Figure 7.
Figure 7.
Histamine production and release is stimulated by live or dead mycoplasma and is dose sensitive. M. pulmonis (M.p.)–stimulated production of histamine was assessed in PMN purified from BM of +/+ and W-sh mice. PMNs and live or heat-killed mycoplasma were cocultured for 200 min using PMN to M. pulmonis CFU ratios of 1:1 (gray bars), 1:10 (hatched bars), and 1:100 (black bars), followed by measurement of total and released histamine. White bars show total and released histamine in PMNs incubated alone, without mycoplasma. Data are mean ± SE; n = 3; P < 0.001 for each 1:100 value versus PMN alone control values, for W-sh 1:10 live M. pulmonis versus PMN alone and versus W-sh 1:100, for +/+ 1:10 live M. pulmonis versus PMN alone and versus +/+ 1:100; P < 0.01 for total histamine W-sh dead M. pulmonis 1:100 and 1:10 versus PMN alone, and for 1:10 versus 1:100.
Figure 8.
Figure 8.
Mycoplasma increases PMN histamine production and HDC transcripts in vitro and in vivo. (A) Total histamine production was measured in BM PMNs purified from mycoplasma-naive +/+ and W-sh mice and incubated with live M. pulmonis in a ratio of 1 neutrophil per 10 CFU. Histamine content also was measured in mycoplasma alone and in PMN purified from M. pulmonis–infected lungs of +/+ and W-sh mice 1 and 7 d after infection, respectively. (B) Histamine released outside of the cell during incubation with mycoplasma was measured in PMN purified from mycoplasma-naive +/+ and W-sh mice. (C) Real time RT-PCR was used to measure expression of mRNA encoding HDC, the rate-limiting enzyme in endogenous production of histamine. Cell sources and conditions are as in A. Results are expressed relative to levels of mRNA encoding HPRT. Data are mean ± SE; n = 3–5 animals per group; *, P < 0.05, **, P < 0.01, and ****, P < 0.0001 compared with no mycoplasma control.
Figure 9.
Figure 9.
Antihistamines attenuate pneumonia and lung to body weight ratio in mycoplasma-infected, mast cell–deficient mice. W-sh mice were treated daily with H1-selective antihistamine (pyrilamine), H2-selective antihistamine (cimetidine), both antihistamines in combination, or saline. Lungs harvested 10 d after infection and 7 d after starting antihistamine treatment were weighed and subjected to histopathological scoring for pneumonia (maximal possible score is 26). The top panel shows pneumonia grades in each group. The bottom panel shows ratio of lung weight (mg) to body weight (g). Data are mean ± SE; n = 5–8 animals per group; *, P < 0.05 and ***, P < 0.001 compared with saline control.

References

    1. Hogan, M.B., and P.A. Greenberger. 1997. Histamine. In Asthma. P.J. Barnes, M.M. Grunstein, A.R. Leff, and A.J. Woolcock, editors. Lipincott-Raven, Philadelphia, PA. 537–545.
    1. Kozma, G.T., G. Losonczy, M. Keszei, Z. Komlosi, E. Buzas, E. Pallinger, J. Appel, T. Szabo, P. Magyar, A. Falus, and C. Szalai. 2003. Histamine deficiency in gene-targeted mice strongly reduces antigen-induced airway hyper-responsiveness, eosinophilia and allergen-specific IgE. Int. Immunol. 15:963–973. - PubMed
    1. Oh, C., S. Suzuki, I. Nakashima, K. Yamashita, and K. Nakano. 1988. Histamine synthesis by non-mast cells through mitogen-dependent induction of histidine decarboxylase. Immunology. 65:143–148. - PMC - PubMed
    1. Saxena, S.P., L.J. Brandes, A.B. Becker, K.J. Simons, F.S. LaBella, and J.M. Gerrard. 1989. Histamine is an intracellular messenger mediating platelet aggregation. Science. 243:1596–1599. - PubMed
    1. Morrow, J.D., G.R. Margolies, J. Rowland, and L.J. Roberts II. 1991. Evidence that histamine is the causative toxin of scombroid-fish poisoning. N. Engl. J. Med. 324:716–720. - PubMed

Publication types

MeSH terms