

Diurnal variation in retinal thickening measurement by optical coherence tomography in center-involved diabetic macular edema
- PMID: 17159029
- PMCID: PMC2279019
- DOI: 10.1001/archopht.124.12.1701
Diurnal variation in retinal thickening measurement by optical coherence tomography in center-involved diabetic macular edema
Abstract
Objective: To evaluate diurnal variation in retinal thickness measured with optical coherence tomography (OCT) in patients with center-involved diabetic macular edema.
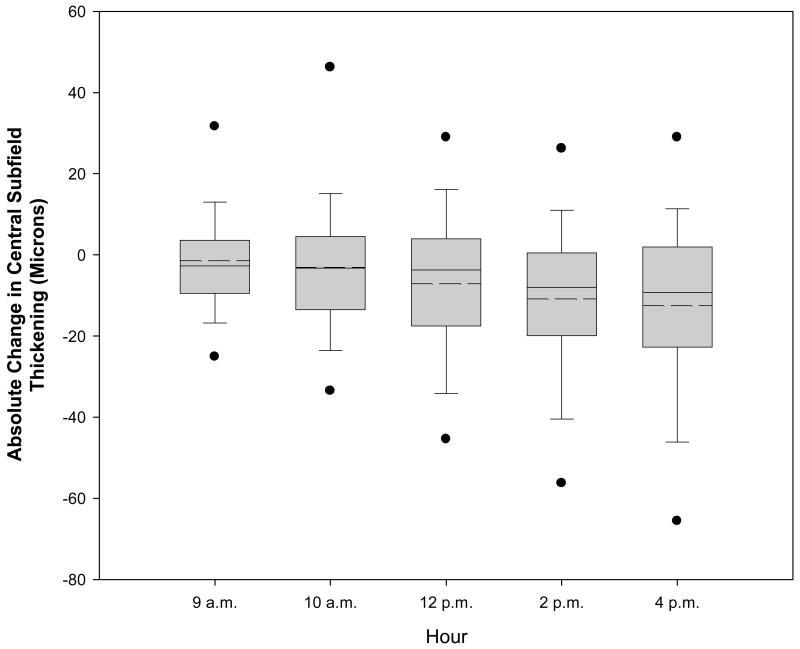
Methods: Serial OCT3 measurements were performed in 156 eyes of 96 subjects with clinically diagnosed diabetic macular edema and OCT central subfield retinal thickness of 225 microm or greater at 8 am. Central subfield thickness was measured from OCT3 retinal thickness maps at 6 points over a single day between 8 am and 4 pm. A change in central subfield thickening (observed thickness minus mean normal thickness) of at least 25% and of at least 50 microm at 2 consecutive points or between 8 am and 4 pm was considered to have met the composite outcome threshold.
Results: At 8 am, the mean central subfield thickness was 368 microm and the mean visual acuity was 66 letters (approximately 20/50). The mean change in relative central subfield retinal thickening between 8 am and 4 pm was a decrease of 6% (95% confidence interval, -9% to -3%) and the mean absolute change was a decrease of 13 microm (95% CI, -17 to -8). The absolute change was significantly greater in retinas that were thicker at 8 am (P<.001) but the relative change was not (P = .14). The composite threshold of reduction in central subfield thickening (as defined above) was observed in 5 eyes of 4 subjects (3% of eyes; 95% CI, 1% to 8%) while 2 eyes of 2 subjects (1%; 95% CI, 0% to 5%) had an increase in central subfield thickening of this same magnitude. The maximum decrease was observed at 4 pm in all 5 eyes.
Conclusion: Although on average there are slight decreases in retinal thickening during the day, most eyes with diabetic macular edema have little meaningful change in OCT central subfield thickening between 8 am and 4 pm.
Conflict of interest statement
There are no conflicts of interest.
Figures


References
-
- Frank RN, Schulz L, Abe K, Iezzi R. Temporal variation in diabetic macular edema measured by optical coherence tomography. Ophthalmology. 2004;111:211–17. - PubMed
-
- Larsen M, Wang M, Sander B. Overnight thickness variation in diabetic macular edema. Invest Ophthalmol Vis Sci. 2005;46:2313–16. - PubMed
-
- Polito A, Del Borrello M, Polini G, Furlan F, Isola M, Bandello F. Diurnal variation in clinically significant diabetic macular edema measured by the stratus OCT. Retina. 2006;26:14–20. - PubMed
-
- Beck RW, Moke PS, Turpin AH, Ferris FL, Sangiovanni JP, Johnson CA, et al. A computerized method of visual acuity testing: adaptation of the early treatment of diabetic retinopathy study testing protocol. Am J Ophthalmol. 2003;135:194–205. - PubMed
-
- Ray R, Stinnett SS, Jaffe GJ. Evaluation of image artifact produced by optical coherence tomography of retinal pathology. Am J Ophthalmol. 2005;139:18–29. - PubMed
Publication types
MeSH terms
Grants and funding
LinkOut - more resources
Full Text Sources
Medical
Miscellaneous
