. 2006 Dec 19;103(51):19272-7.
doi: 10.1073/pnas.0604663103. Epub 2006 Dec 11.

A fully integrated microfluidic genetic analysis system with sample-in-answer-out capability

Affiliations

A fully integrated microfluidic genetic analysis system with sample-in-answer-out capability

Christopher J Easley et al. Proc Natl Acad Sci U S A. .

Abstract

We describe a microfluidic genetic analysis system that represents a previously undescribed integrated microfluidic device capable of accepting whole blood as a crude biological sample with the endpoint generation of a genetic profile. Upon loading the sample, the glass microfluidic genetic analysis system device carries out on-chip DNA purification and PCR-based amplification, followed by separation and detection in a manner that allows for microliter samples to be screened for infectious pathogens with sample-in-answer-out results in < 30 min. A single syringe pump delivers sample/reagents to the chip for nucleic acid purification from a biological sample. Elastomeric membrane valving isolates each distinct functional region of the device and, together with resistive flow, directs purified DNA and PCR reagents from the extraction domain into a 550-nl chamber for rapid target sequence PCR amplification. Repeated pressure-based injections of nanoliter aliquots of amplicon (along with the DNA sizing standard) allow electrophoretic separation and detection to provide DNA fragment size information. The presence of Bacillus anthracis (anthrax) in 750 nl of whole blood from living asymptomatic infected mice and of Bordetella pertussis in 1 microl of nasal aspirate from a patient suspected of having whooping cough are confirmed by the resultant genetic profile.


Conflict of interest statement

The authors declare no conflict of interest.

Figures
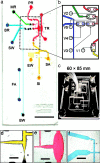
Fig. 1.
Fig. 1.
Images of the MGA device. (a) Dyes are placed in the channels for visualization (Scale bar, 10 mm.). Domains for DNA extraction (yellow), PCR amplification (red), injection (green), and separation (blue) are connected through a network of channels and vias. SPE reservoirs are labeled for sample inlet (SI), sidearm (SA), and extraction waste (EW). Injection reservoirs are labeled for PCR reservoir (PR), marker reservoir (MR), and sample waste (SW). Electrophoresis reservoirs are labeled for buffer reservoir (BR) and buffer waste (BW). Additional domains patterned onto the device include the temperature reference (TR) chamber and fluorescence alignment (FA) channel. The flow control region is outlined by a dashed box. Device dimensions are 30.0 × 63.5 mm, with a total solution volume <10 μl. (Scale bar, 10 mm.) (b) Schematic of flow control region. Valves are shown as open rectangles. V1 separates the SPE and PCR domains. V2 and V5 are inlet valves for the pumping injection, V3 is the diaphragm valve, and V4 is an outlet valve. (c) Device loaded into the manifold. (d) Intersection between SI and SA inlet channels, with the EW channel tapering to increase flow resistance. (Scale bar, 1 mm.) (e) Image of PCR chamber with exit channel tapering before intersecting with the MR inlet channel. (Scale bar, 1 mm.) (f) Image of cross-tee intersection. (Scale bar, 1 mm.) The relative sizes of the BR, SW, and BW channels create the difference in volume displacement during the pumping injection and affect how the resistance is dropped under an applied separation voltage.
Fig. 2.
Fig. 2.
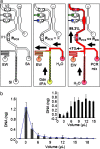
Data and flow illustrations representing the coupling of SPE and PCR sample preparation steps on the MGA device using elastomeric valves and flow control preset by channel design. (a) Flow control between SPE and PCR was accomplished by using differential channel flow resistances, laminar flow, and valving. During the load and wash steps of SPE (center), valve V1 is closed, making the flow path to PCR highly resistant compared with the extraction waste (EW) path (RPCR ≈ ∞), and directing all flow to EW. Note that because of laminar flow between the SA and SI channels, the guanidine-HCl and isopropanol solutions (yellow) never contact the valve seats. During the DNA elution step (Right), valves V1 and V2 are opened, allowing 99.3% of the flow (by calculation) to proceed to the PCR domain (RPCRREW). (b) Elution profile of a human genomic DNA extraction from blood using real-time qPCR to determine the amount of DNA eluted from the MGA device. The results demonstrate which volume fractions will be most appropriate for use in downstream PCR amplification in the fully integrated analysis. Replicate breakthrough profiles were also obtained (inset), and the capacity of the solid phase was determined to be 3.3 ng of DNA.
Fig. 3.
Fig. 3.
Integrated detection of B. anthracis from murine blood. (a) Detector responses during all three stages of sample processing and analysis are portrayed in terms of total analysis time. The SPE trace (green) was taken from an offline DNA extraction of the same murine sample and is representative of the total DNA concentration observed in a typical extraction. The temperature (blue) and fluorescence intensity (black) represent online data, with a total analysis time of <24 min. Three sequential injections and separations were carried out to ensure the presence of amplified product. (b) Fluorescence data from an integrated analysis of a blank sample (no DNA loaded) control with marker peaks labeled. The cartoon (Inset) represents valve actuation during the coinjection, with the PR and MR pumping inlets indicated by the arrows. (c) Zoomed in view of the first separation shown in a, with the product peak marked and sized. The second and third runs are overlaid with the time axis cropped. The plot (Inset) shows the sizing curve of inverse migration time vs. log (base pairs) with both the sizing standard peaks (open diamonds) and product (red square) plotted for all three runs shown in a (error bars included). From these data, the product was sized as 211 ± 2 bp.
Fig. 4.
Fig. 4.
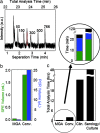
Fully integrated microchip detection of B. pertussis from a human nasal aspirate in only 24 min. One microliter of human nasal aspirate was extracted, PCR was performed on the purified DNA, and products were pressure-injected and electrophoresed. (a) The ME trace was plotted alone to show the separation of the coinjected DNA sizing standard (peak sizes labeled in number of base pairs) with the PCR amplicon for product verification. The amplicon (red) migrates between the expected size standards, and sequencing analysis was used to further verify the product (see SI Supporting Text). (b) Volumes for SPE (green) and PCR (blue) are compared for MGA and Conv., showing a significant reduction for both processes. (c) Total analysis times for crude biological samples of the MGA device (from a), conventional analysis performed in the research lab (Conv.) and a clinical lab (Clin.), and analysis by serology/cell culture. Analysis times for MGA and Conv. are shown in (Inset), with SPE (green), PCR (blue), and ME (black) denoted.

References

    1. Manz A, Graber N, Widmer HM. Sens Act B. 1990;1:244–248.
    1. Lagally ET, Scherer JR, Blazej RG, Toriello NM, Diep BA, Ramchandani M, Sensabaugh GF, Riley LW, Mathies RA. Anal Chem. 2004;76:3162–3170. - PubMed
    1. Pal R, Yang M, Lin R, Johnson BN, Srivastava N, Razzacki SZ, Chomistek KJ, Heldsinger DC, Haque RM, Ugaz VM, et al. Lab Chip. 2005;5:1024–1032. - PubMed
    1. Liu J, Enzelberger M, Quake S. Electrophoresis. 2002;23:1531–1536. - PubMed
    1. Auroux PA, Koc Y, deMello A, Manz A, Day PJ. Lab Chip. 2004;4:534–546. - PubMed

Publication types

MeSH terms

LinkOut - more resources