Comparative Study
. 2006 Dec 19;103(51):19541-5.
doi: 10.1073/pnas.0604478104. Epub 2006 Dec 11.

Hypoglycemia leads to age-related loss of vision

Affiliations
Comparative Study

Hypoglycemia leads to age-related loss of vision

Y Umino et al. Proc Natl Acad Sci U S A. .

Abstract

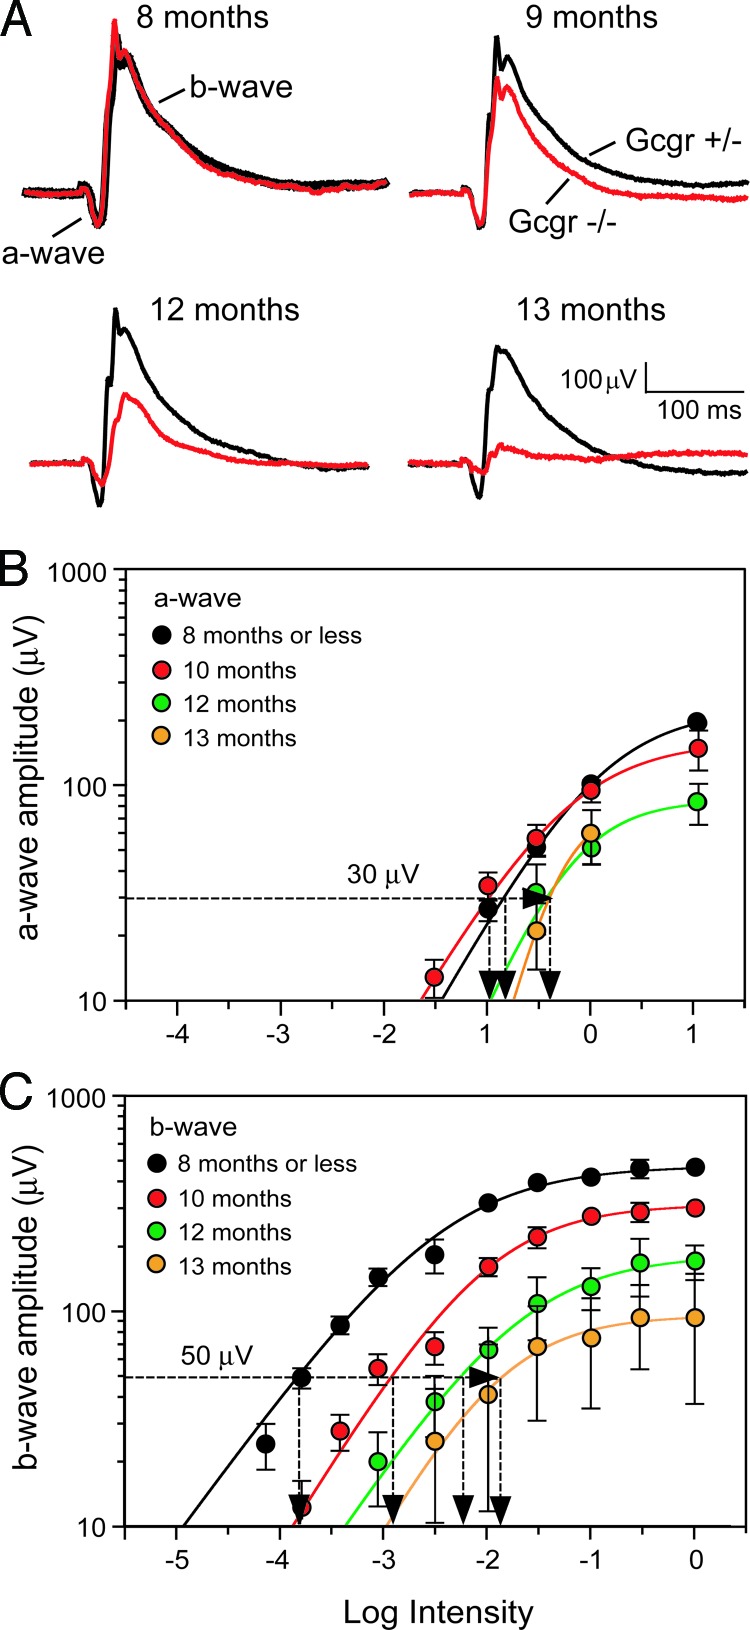
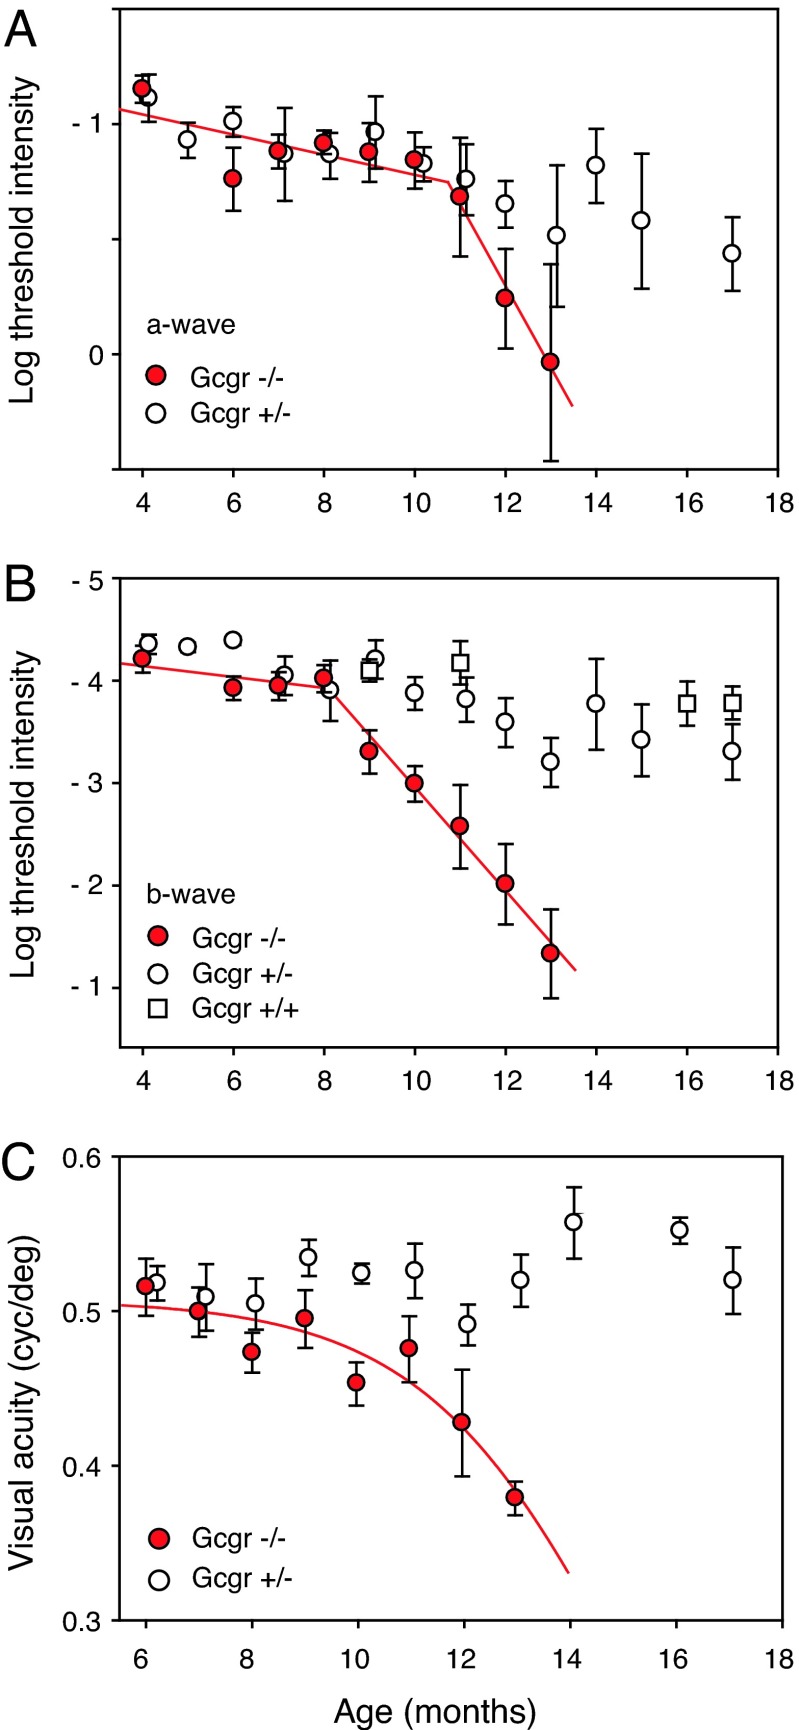
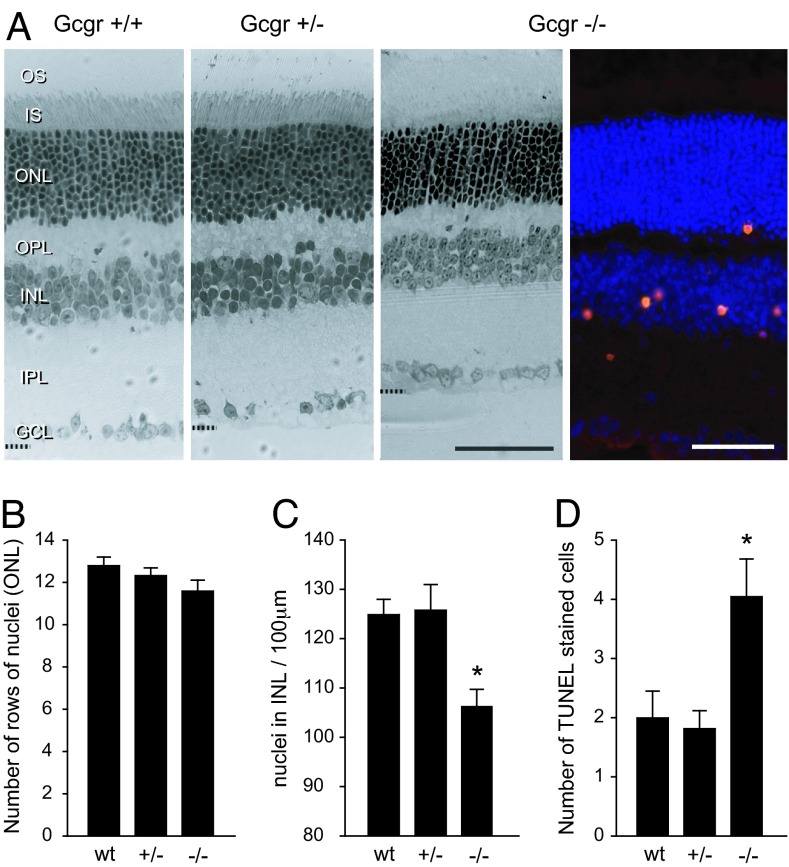
The retina is among the most metabolically active tissues in the body, requiring a constant supply of blood glucose to sustain function. We assessed the impact of low blood glucose on the vision of C57BL/6J mice rendered hypoglycemic by a null mutation of the glucagon receptor gene, Gcgr. Metabolic stress from moderate hypoglycemia led to late-onset loss of retinal function in Gcgr(-/-) mice, loss of visual acuity, and eventual death of retinal cells. Retinal function measured by the electroretinogram b-wave threshold declined >100-fold from age 9 to 13 months, whereas decreases in photoreceptor function measured by the ERG a-wave were delayed by 3 months. At 10 months of age Gcgr(-/-) mice began to lose visual acuity and exhibit changes in retinal anatomy, including an increase in cell death that was initially more pronounced in the inner retina. Decreases in retinal function and visual acuity correlated directly with the degree of hypoglycemia. This work demonstrates a metabolic-stress-induced loss of vision in mammals, which has not been described previously. Linkage between low blood glucose and loss of vision in mice may highlight the importance for glycemic control in diabetics and retinal diseases related to metabolic stress as macular degeneration.


Conflict of interest statement

The authors declare no conflict of interest.

Figures

Fig. 1.
Fig. 1.
Age-related changes in the ERG. (A) Average ERGs recorded from a group of moderately hypoglycemic Gcgr−/− mice (red traces; n = 3) and euglycemic Gcgr+/− mice (black traces; n = 4) in response to 10-ms flashes. (B) Intensity-response functions of a-waves recorded from moderately hypoglycemic Gcgr−/− mice ages ≤8 to 13 months. (C) Intensity-response functions of b-waves from the same ERGs that yielded the a-waves in B. Dashed horizontal lines and vertical intercepts on the abscissa show the method for determining threshold light intensities (It). Responses in B and C were recorded at ≤8, 10, 12, and 13 months from 12, 17, 7, and 4 Gcgr−/− mice, respectively.
Fig. 2.
Fig. 2.
Tracking changes in retinal function and visual acuity. (A) Phototransduction (a-wave) activity of moderately hypoglycemic Gcgr−/− mice (red symbols) and euglycemic Gcgr+/− mice (open circles; n = 6–8) as a function of age. Euthanization of older Gcgr−/− mice for retinal histology limited sample size at 9, 10, 11, 12, and 13 months to 13, 12, 10, 7, and 4 mice, respectively. The large spread of data at 13 months results from small sample size (n = 4) and lack of ERG from one mouse. (B) Age-related changes in postphototransduction (b-wave) response (see Methods) of the same group of Gcgr−/− and Gcgr+/− mice plus Gcgr+/+ mice (open squares; n = 4–6). Red line segments are least-squares fits. (C) Visual acuity of moderately hypoglycemic Gcgr−/− mice (red symbols) and euglycemic littermate Gcgr+/− mice (open circles; n = 3–8). Euthanization for histology limited the data at 11, 12, and 13 months to 9, 7, and 5 mice, respectively. Red curve is a polynominal fit. Median illumination at the surface of the cornea was 70 cdm−2. Bars are SEM.
Fig. 3.
Fig. 3.
BG independently modulates retinal and visual function. (A and B) Retinal response threshold (A) and visual acuity (B) plotted as functions of BG of Gcgr−/− and Gcgr+/− mice. Results were averaged according to BG levels by clustering BG levels into six bins (15 mg/dl wide) from 60 to 150 mg/dl. Data were acquired from 17 Gcgr+/− and 14 Gcgr−/− mice (A) and from 11 Gcgr+/− and 10 Gcgr−/− mice (B) with up to four trials per mouse. (C) Comparison of retinal response thresholds of Gcgr−/− and Gcgr+/− mice maintained on a regular diet with Gcgr−/− mice placed on a high-carbohydrate diet beginning at 6–7 months of age (n = 5–7). Gcgr−/− mice on a high-carbohydrate diet were significantly different from Gcgr−/− mice on regular diet (∗, P < 0.05, one-way ANOVA; Holm–Sidak test). Bars are SEM.
Fig. 4.
Fig. 4.
Progressive changes in retinal anatomy. (A) Light micrographs of axial plastic-embedded sections of retinas from age-matched adult Gcgr+/+, Gcgr+/−, and moderately hypoglycemic Gcgr−/− mice (leftmost three sections; 1-μm thick). Shown are photoreceptors (outer segments, OS; inner segments, IS) at the top and the ganglion cell layer (GCL) at the bottom. Visible in between are the OPL and IPL and the densely stained cell bodies in the ONL and INL. The oblique cryosection on the right from a Gcgr−/− mouse shows TUNEL staining primarily in the INL. The different fixation methods caused differential tissue shrinkage. (Scale bars: 50 μm.) (B) Numbers of rows of cell nuclei counted in ONL of Gcgr+/+ (n = 5), Gcgr+/− (n = 6), and Gcgr−/− (n = 7) mice are not significantly different. (C) Numbers of INL cells counted within 100-μm horizontal sectors are significantly fewer for Gcgr−/− mice than for Gcgr+/+ and Gcgr+/− mice. (D) Average number of TUNEL-positive cells is significantly greater (∗, P < 0.05) for Gcgr−/− mice (n = 12) than for Gcgr+/+ (n = 8) and Gcgr+/− (n = 11) mice.

References

    1. McFarland RA, Halperin MH, Niven JI. Am J Physiol. 1945;144:378–388.
    1. Tabandeh H, Ranganath L, Marks V. Eur J Ophthalmol. 1996;6:81–86. - PubMed
    1. McGrimmon RJ, Deary IJ, Huntly BJP, MacLeod KJ, Frier BM. Brain. 1996;119:1277–1287. - PubMed
    1. McFarland RA, Forbes WH. J Gen Physiol. 1940;24:69–98. - PMC - PubMed
    1. Clore J, Nestler J, Blackard W. Diabetes. 1989;38:285–290. - PubMed

Publication types

LinkOut - more resources