. 2007 Jan 10;26(1):184-96.
doi: 10.1038/sj.emboj.7601480. Epub 2006 Dec 7.

Characterization of GATA-1(+) hemangioblastic cells in the mouse embryo

Affiliations

Characterization of GATA-1(+) hemangioblastic cells in the mouse embryo

Tomomasa Yokomizo et al. EMBO J. .

Abstract

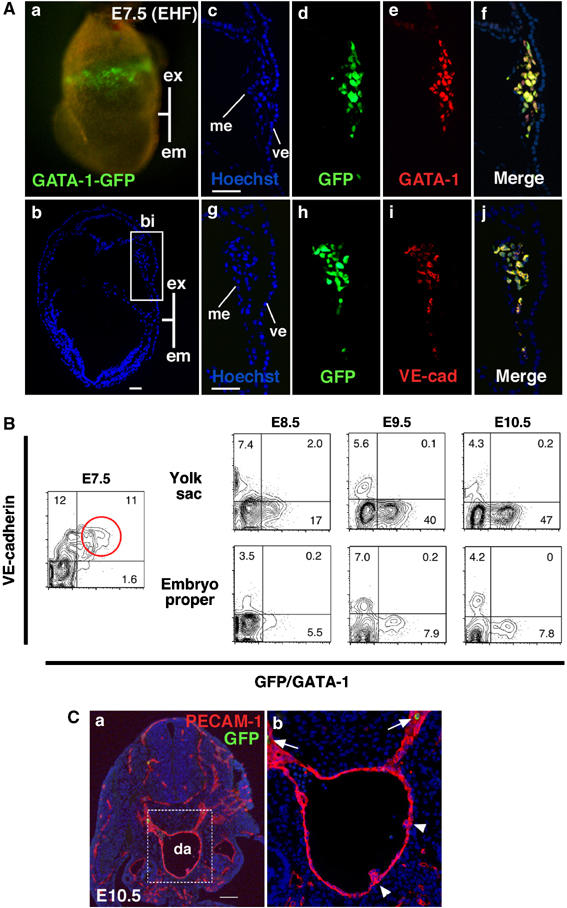
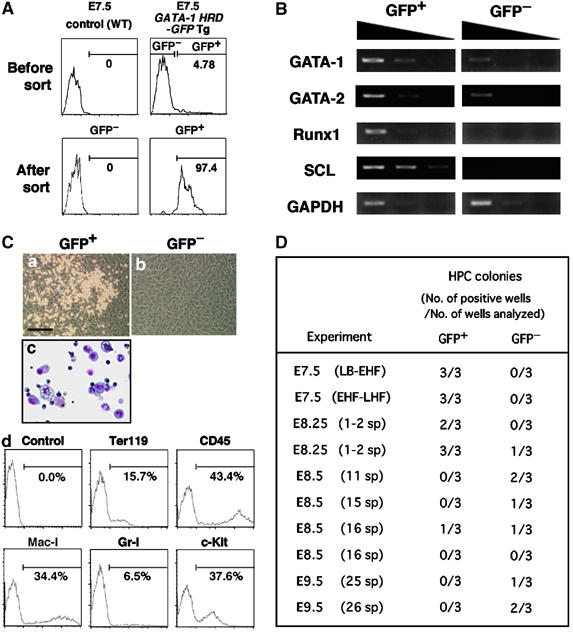
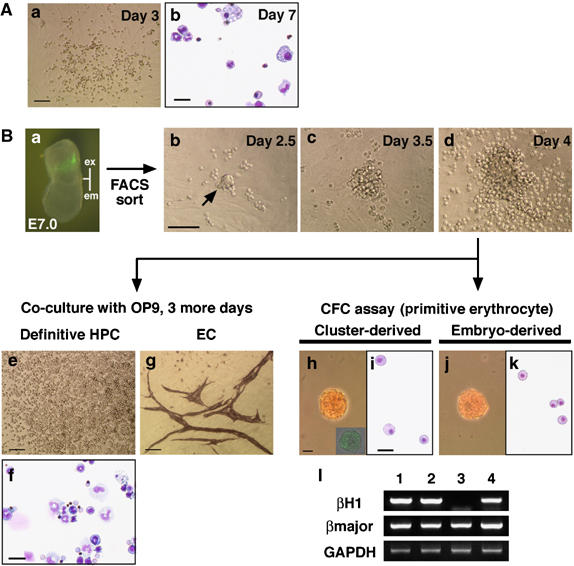
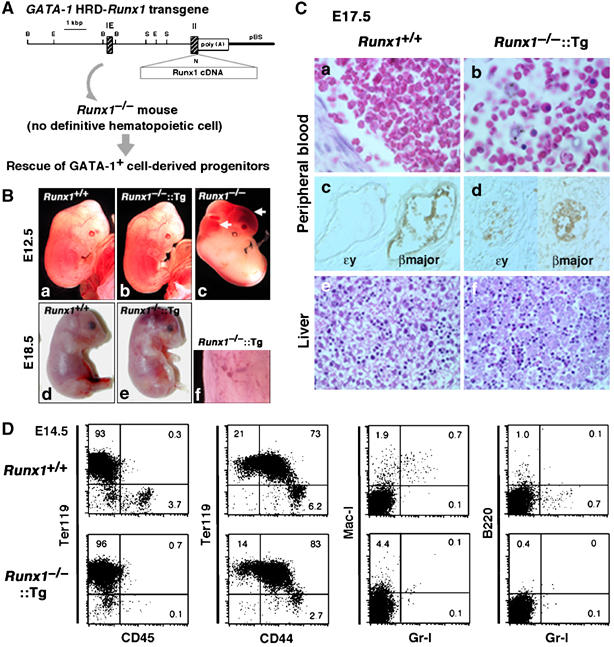
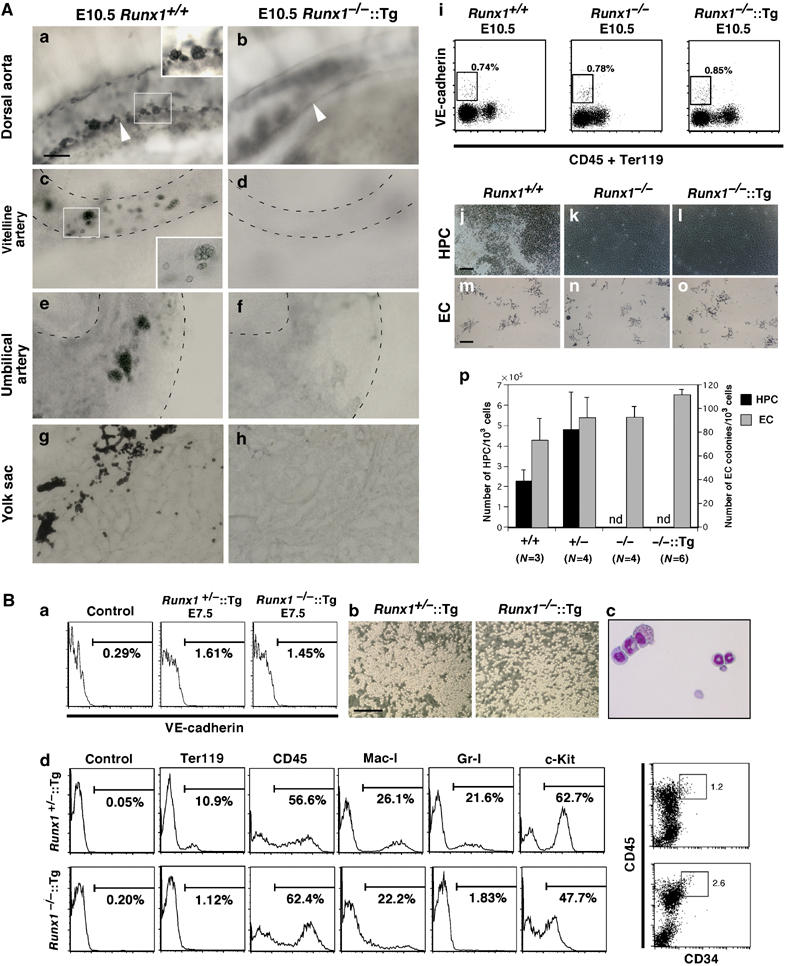
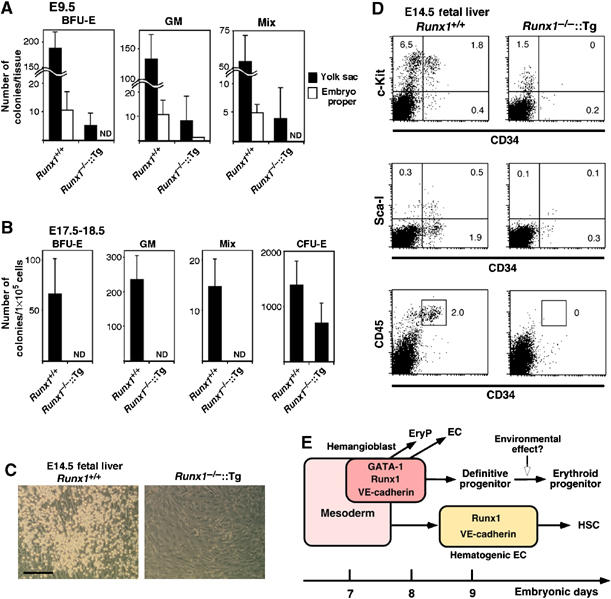
Hemangioblasts are thought to be one of the sources of hematopoietic progenitors, yet little is known about their localization and fate in the mouse embryo. We show here that a subset of cells co-expressing the hematopoietic marker GATA-1 and the endothelial marker VE-cadherin localize on the yolk sac blood islands at embryonic day 7.5. Clonal analysis demonstrated that GATA-1(+) cells isolated from E7.0-7.5 embryos include a common precursor for hematopoietic and endothelial cells. Moreover, this precursor possesses primitive and definitive hematopoietic bipotential. By using a transgenic complementation rescue approach, GATA-1(+) cell-derived progenitors were selectively restored in Runx1-deficient mice. In the rescued mice, definitive erythropoiesis was recovered but the rescued progenitors did not display multilineage hematopoiesis or intra-aortic hematopoietic clusters. These results provide evidence of the presence of GATA-1(+) hemangioblastic cells in the extra-embryonic region and also their functional contribution to hematopoiesis in the embryo.


Figures

Figure 1
Figure 1
GATA-1+ cells in blood islands coexpress VE-cadherin. (A) Immunohistochemical analysis of G1-HRD-GFP transgenic embryo at E7.5 (early headfold stage, EHF). (a) Fluorescence microscopic analysis shows GFP+ cells are present in the blood islands. (b) Section of (a). The blue color represents staining with Hoechst 33342. (c–j) Serial sections of the blood island depicted in the boxed region in (b). Hoechst dye staining is shown in (c) and (g). Staining with anti-GFP (d and h), anti-GATA-1 (e) and anti-VE-cadherin (i) antibodies are also shown. Merged images of GFP and GATA-1 (f) and GFP and VE-cadherin (j). (B) FACS analysis of G1-HRD-GFP transgenic embryos. Note that most GFP+ cells are positive for VE-cadherin+ (highlighted by a red circle) at E7.5. (C) Immunohistochemical analysis of G1-HRD-GFP transgenic embryo at E10.5. Transverse section of AGM region, stained with anti-GFP (green) and anti-PECAM-1 (red) antibodies. The dorsal aspect is upward. (b) This is higher magnification of the area within (a) indicated by the box. GFP+ cells (white arrows) are observed in circulating cells, not in endothelial cells or hematopoietic cell clusters (white arrowheads). Abbreviations: ex, extra-embryonic region; em, embryonic region; bi, blood island; ve, visceral endoderm; me, mesothelium; da, dorsal aorta. Scale bars: (A) 50 μm; (C) 100 μm.
Figure 2
Figure 2
Definitive hematopoietic potential resides in GATA-1+ cells at E7.5. (A) FACS profile of the cells derived from E7.5 G1-HRD-GFP transgenic embryos. GFP+ and GFP cells were sorted (upper panel, right) and re-analyzed (lower panels). (B) RT–PCR analysis of the expression of hematopoietic transcription factor mRNAs in GFP+ and GFP cells sorted from E7.5 embryos. (C) Definitive hematopoietic potential of GFP+ cells derived from E7.5 G1-HRD-GFP transgenic embryo. Both GFP+ and GFP cells were cultured on an OP9 stromal cell layer in the presence of SCF, IL-3, G-CSF and Epo. A phase-contrast microscopic photograph was taken after 4 days of culture (a and b). After 9 days of culture, the cells formed in the culture of GFP+ cells were harvested and analyzed for morphology (c) and the expression of surface markers (d). Erythrocytes, granulocytes and monocytes/macrophages were identified. Scale bar: 200 μm. (D) Definitive hematopoietic potential of GFP+ and GFP cells sorted from embryos of different stages. The frequency of hematopoietic colony development was examined with the OP9 stromal cell culture. 500 cells were cultured per well under the same conditions as described in (C). The generation of hematopoietic colonies was judged by their morphology after 7 days of culture. Stages determined by morphological appearance are presented in parentheses. LB–EHF represents a mixture of LB and EHF stage embryos. Abbreviations: LB, late bud; EHF, early headfold; LHF, late headfold; sp, somite pairs.
Figure 3
Figure 3
Single GATA-1+ cells can differentiate into primitive and definitive hematopoietic cells and endothelial cells. GFP+ cells isolated from G1-HRD-GFP transgenic mouse were deposited into individual wells of a 96-well plate and cultured with OP9 stromal cells in the presence of SCF, IL-3, G-CSF, Epo, VEGF and Ang-1. (A) Analysis of GFP+ cells sorted from E7.5 (early to late headfold stage) embryos. A phase-contrast microscopic photograph was taken after 3 days of culture (a). After 7 days of culture, the cells formed in the culture of GFP+ cells were harvested and analyzed for morphology (b). Erythrocytes, granulocytes and monocytes/macrophages were identified. (B) Analysis of GFP+ cells sorted from E7.0 (mid-streak to no bud stage) embryos. (a) Representative picture of E7.0 embryo (no bud/early bud stage). Abbreviations: ex, extra-embryonic region; em, embryonic region. A densely packed cluster was detected at day 2 of culturing (b, arrow) and grown to a larger size (c), with the generation of round cells around it (d). Note that the shape of the colony is different from that of a typical colony formed in E7.5 culture (A(a)). After 4 days of culture, the progeny of the cluster was replated onto fresh OP9 stromal cells (e) and in methylcellulose (h). The culture remaining after harvesting was also investigated for the detection of endothelial cell colonies (g). (e and f) Erythrocytes, granulocytes and monocytes/macrophages were identified in the replated dish after an additional 3 days of culture. (g) Endothelial cell colonies formed on OP9 stromal cells were visualized by immunostaining with anti-PECAM-1 antibody. (h–l) Generation of primitive erythroid colonies from clusters. Morphology of primitive erythroid colony generated from replated clusters (h and i) was similar to those from E7.5 embryo (j and k). Inset in (h) shows a GFP-expressing colony detected by fluorescence microscopy. (l) RT–PCR analysis of globin gene expression in the colonies. Both βH1 and βmajor globins were detected in the colonies derived from the clusters (lane 4). Peripheral blood from E10.5 embryo, primitive erythroid colonies from E7.5 embryo (primitive erythrocytes, lanes 1 and 2, respectively) and BFU-E from E10.5 yolk sac (definitive erythrocytes, lane 3) were used as controls. Scale bars: (Aa, Bb, Be, and Bg) 100 μm; (Ab, Bf, Bh, and Bi) 25 μm.
Figure 4
Figure 4
Rescue of GATA-1+ cell-derived progenitors in Runx1−/− embryos. (A) Strategy for the rescue of GATA-1+ cell-derived progenitors in Runx1−/− embryos. The G1-HRD-Runx1 transgene contains the 3.9-kb sequence 5′ of the IE exon, the IE exon itself, the first intron, and a part of the second exon of the mouse GATA-1 gene in front of Runx1 cDNA. The initiation Met codon in the second exon was replaced by a unique NotI site (shown as N) for subsequent cloning. Restriction enzyme sites are B, BamHI; E, EcoRI; N, NotI; S, SacI. (B) Macroscopic appearance of G1-HRD-Runx1 transgene-rescued embryos. Embryos with each genotype at E12.5 (a–c) and E18.5 (d and e) are shown. A higher magnification picture of the skin of transgene-rescued embryo (f) reveals micro-hemorrhages in the skin. (C) Histological analysis of wild type and Runx1−/−∷Runx1-Tg+ embryos at E17.5. Hematoxylin and eosin staining of peripheral blood from wild type (a) and Runx1−/−∷Runx1-Tg+ (b) embryos are shown. Note that numerous enucleated erythrocytes are present in the Runx1−/−∷Runx1-Tg+ embryos. Panels (c) and (d) show sections stained with anti-βmajor globin antibody or anti-ɛy globin antibody. Hematoxylin and eosin-stained livers of wild type (e) and Runx1−/−∷Runx1-Tg+ (f) embryos. (D) FACS analysis of E14.5 fetal liver cells from wild type and Runx1−/−∷Runx1-Tg+ embryos.
Figure 5
Figure 5
Definitive hematopoietic potential is recovered in VE-cadherin+ cells from E7.5, but not from E10.5, Runx1−/−∷Runx1-Tg+ embryos. (A) The absence of hematopoietic cell clusters and definitive hematopoietic potential of VE-cadherin+ endothelial cells in E10.5 Runx1−/−∷Runx1-Tg+embryos. (a–h) Detection of hematopoietic cell clusters in wild type and Runx1−/−∷Runx1-Tg+ embryos. Embryos at E10.5 were processed for whole-mount c-Kit staining and cleared to visualize the hematopoietic cell clusters. (a and b) Side-view of the dorsal aorta. In the wild-type embryos, many c-Kit+ cell clusters were attached to the ventral wall of the dorsal aorta (a, white arrowhead), whereas no c-Kit+ cell clusters were present in the transgene-rescued Runx1−/− embryos (b). Similar results were obtained in the vitelline artery (c and d), umbilical artery (e and f) and yolk sac (g and h; flat-mount preparation). Scale bar: 20 μm. (i–p) Endothelial cells (VE-cadherin+CD45Ter119) sorted from the transgene-rescued Runx1−/−embryos could not differentiate into hematopoietic cells in vitro. (i) Surface expression of VE-cadherin, CD45 and Ter119 in Runx1+/+, Runx1−/− and Runx1−/−∷Runx1-Tg+ embryos at E10.5. Cells from the caudal half of the embryo proper and yolk sac were stained with APC-anti-VE-cadherin, FITC-anti-CD45 and OrGreen-anti-Ter119 antibodies. Percentages of cells that fell within the sorting parameters (boxes) are indicated. (j–o) Development of hematopoietic and endothelial cell colonies in the culture of sorted endothelial cells. VE-cadherin+/CD45/Ter119 endothelial cells sorted from Runx1+/+, Runx1−/− and Runx1−/−∷Runx1-Tg+ embryos as indicated in (i) were cultured on an OP9 stromal layer in the presence of SCF, IL-3, G-CSF and Epo. Photographs were taken by a phase-contrast microscope after 4 days of culture (j–l). Hematopoietic cells were generated from Runx1+/+ endothelial cells (j), whereas no hematopoietic cells were detected in the culture containing Runx1−/− or Runx1−/−∷Runx1-Tg+ endothelial cells (k and l). (m–o) Immunostaining with anti-PECAM-1 antibody after 7 days of culture shows endothelial cell colonies. No significant differences were detectable in the size or morphology of the colonies between Runx1+/+ and Runx1−/−∷Runx1-Tg+ endothelial cells. (p) Numbers of hematopoietic and endothelial cell colonies in the culture of sorted endothelial cells. Scale bars: (j–l) 100 μm; (m–o) 200 μm. Abbreviations: HPC, hematopoietic cells; EC, endothelial cells; ND, not detected. (B) Definitive hematopoietic potential in VE-cadherin+ cells from E7.5 Runx1−/−∷Runx1-Tg+ embryos. (a) Surface expression of VE-cadherin in Runx1+/–∷Runx1-Tg+ and Runx1−/−∷Runx1-Tg+ embryos at E7.5 (early headfold stage). The cells that disaggregated from whole embryo were stained with APC-anti-VE-cadherin antibody. Genotyping was performed using the sorted VE-cadherin fraction. (b) Development of hematopoietic cell colonies in the culture of sorted VE-cadherin+ cells. VE-cadherin+ cells derived from Runx1+/–∷Runx1-Tg+ and Runx1−/−∷Runx1-Tg+ embryos as indicated in (a) were cultured on an OP9 stromal layer in the presence of SCF, IL-3, G-CSF and Epo. Photographs were taken by phase-contrast microscopy after 6 days of culture. Scale bar: 200 μm. (c) Cytocentrifuge preparation of cultured cells. May–Grunwald Giemsa staining. Erythrocytes, granulocytes and macrophages were identified. (d) Hematopoietic potential of VE-cadherin+ cells from E7.5 Runx1+/–∷Runx1-Tg+ embryo. Cells were harvested and analyzed after 9 days of culture.
Figure 6
Figure 6
The absence of uncommitted progenitors and HSCs in Runx1−/−∷Runx1-Tg+ fetal liver. Colonies arising from E9.5 (21–28 somite stage) embryos (A) and E17.5–18.5 fetal liver cells (B) in the semisolid medium. nd means not detected. (C) Hematopoietic potential of E14.5 fetal liver progenitors on OP9 stromal cells. Phase-contrast microscopic views of the culture are shown. Adherent, round hematopoietic colonies were generated from 103 cells from Runx1+/+ fetal liver, whereas no colonies were detected in the culture of 106 cells from Runx1−/−∷Runx1-Tg+ fetal liver. Scale bar: 200 μm. (D) Expression of hematopoietic stem cell markers in E14.5 fetal liver cells from wild type or rescued embryos. (E) Schematic representation of multiple pathways for hematopoiesis in mouse embryos. Abbreviations: EC, endothelial cells; EryP, primitive erythrocytes.

Similar articles

Cited by

References

    1. Adya N, Castilla LH, Liu PP (2000) Function of CBFβ/Bro proteins. Semin Cell Dev Biol 11: 361–368 - PubMed
    1. Bertrand JY, Giroux S, Golub R, Klaine M, Jalil A, Boucontet L, Godin I, Cumano A (2005) Characterization of purified intraembryonic hematopoietic stem cells as a tool to define their site of origin. Proc Natl Acad Sci USA 102: 134–139 - PMC - PubMed
    1. Cai ZL, de Bruijn M, Ma XQ, Dortland B, Luteijn T, Downing JR, Dzierzak E (2000) Haploinsufficiency of AML1 affects the temporal and spatial generation of hematopoietic stem cells in the mouse embryo. Immunity 13: 423–431 - PubMed
    1. Choi K (2002) The hemangioblast: a common progenitor of hematopoietic and endothelial cells. J Hematother Stem Cell Res 11: 91–101 - PubMed
    1. Choi K, Kennedy M, Kazarov A, Papadimitriou JC, Keller G (1998) A common precursor for hematopoietic and endothelial cells. Development 125: 725–732 - PubMed

Publication types