Comparative Study
. 2007 Jan;39(1):120-5.
doi: 10.1038/ng1931. Epub 2006 Dec 10.

Genome variation and evolution of the malaria parasite Plasmodium falciparum

Affiliations
Comparative Study

Genome variation and evolution of the malaria parasite Plasmodium falciparum

Daniel C Jeffares et al. Nat Genet. 2007 Jan.

Erratum in

  • Nat Genet. 2007 Apr;39(4):567
  • Nat Genet. 2007 Mar;39(3):422

Abstract

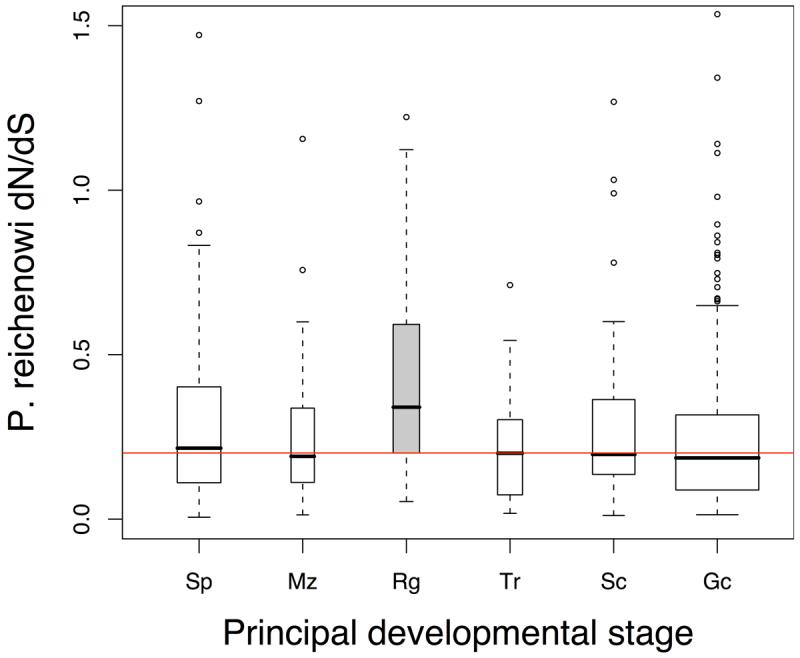
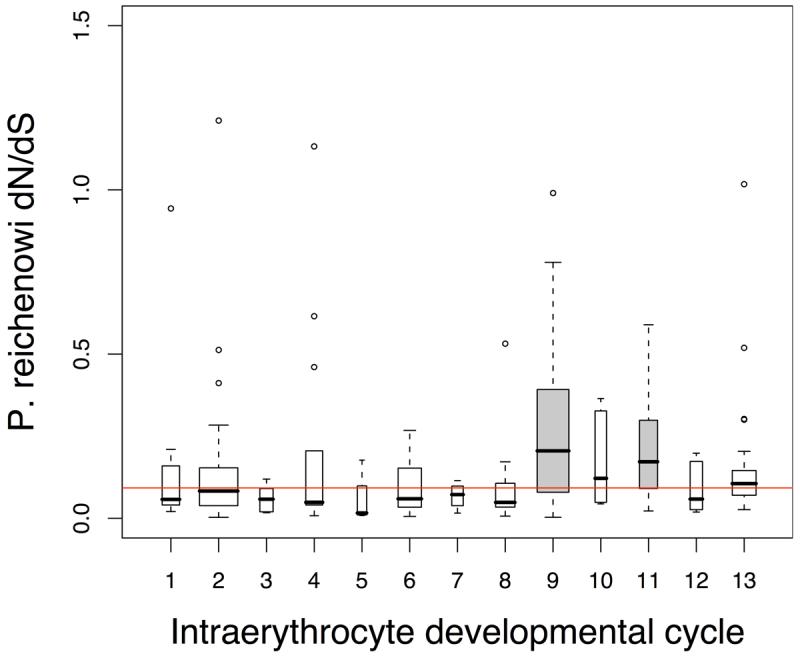
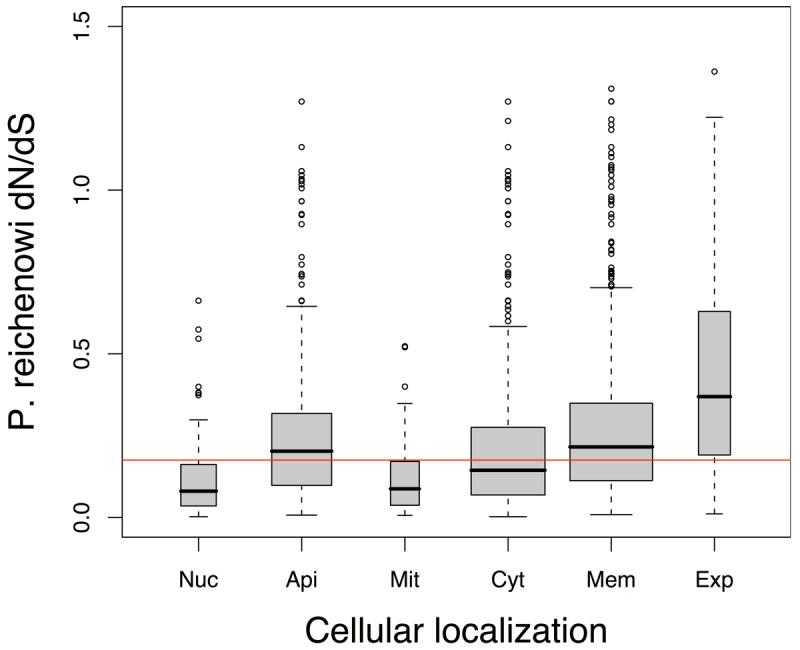
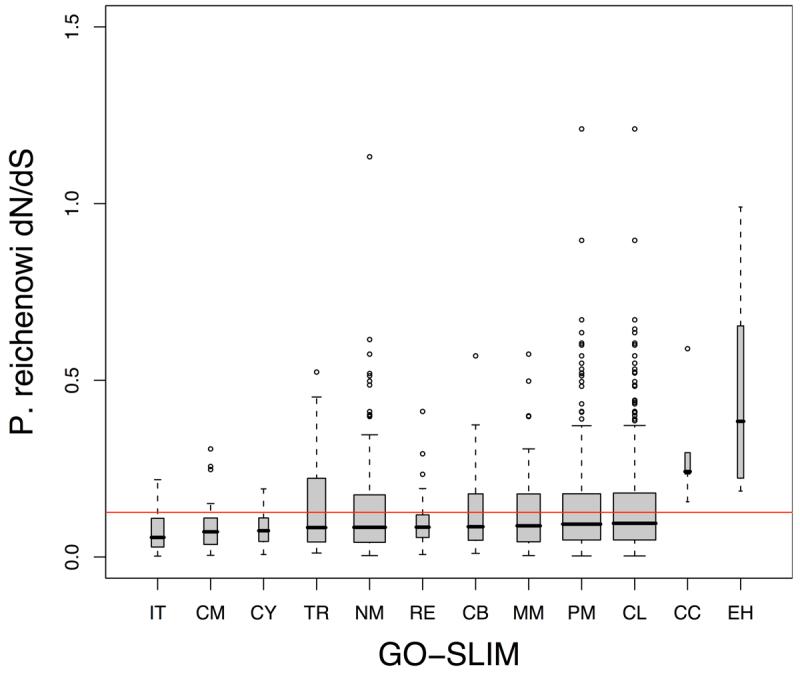
Infections with the malaria parasite Plasmodium falciparum result in more than 1 million deaths each year worldwide. Deciphering the evolutionary history and genetic variation of P. falciparum is critical for understanding the evolution of drug resistance, identifying potential vaccine candidates and appreciating the effect of parasite variation on prevalence and severity of malaria in humans. Most studies of natural variation in P. falciparum have been either in depth over small genomic regions (up to the size of a small chromosome) or genome wide but only at low resolution. In an effort to complement these studies with genome-wide data, we undertook shotgun sequencing of a Ghanaian clinical isolate (with fivefold coverage), the IT laboratory isolate (with onefold coverage) and the chimpanzee parasite P. reichenowi (with twofold coverage). We compared these sequences with the fully sequenced P. falciparum 3D7 isolate genome. We describe the most salient features of P. falciparum polymorphism and adaptive evolution with relation to gene function, transcript and protein expression and cellular localization. This analysis uncovers the primary evolutionary changes that have occurred since the P. falciparum-P. reichenowi speciation and changes that are occurring within P. falciparum.


Figures

Figure 1
Figure 1. Evolutionary rates correlate with total gene expression levels
a. Scatter plot of PFCLIN dN/dS and total protein expression. Because longer proteins would be expected to be detected more frequently in mass spectrometry analysis total protein measures are corrected for protein length by dividing by predicted coding length of gene (mass spec. counts/CDS length plotted on x axis). The PFCLIN dN/dS correlates with corrected total protein levels from all developmental stages (Spearman rank r = −0.16, P = 5.6×10⁻⁴). Some data points with x values > 0.1 are not shown on this plot. PFCLIN dN/dS estimates were also correlated with total RNA expression levels (Fig S2). b. Scatter plot of P. reichenowi dN/dS and total transcript expression. The P. reichenowi dN/dS correlates with total transcript from all developmental stages (Spearman rank correlation, r = −0.22, P < 2×10⁻¹⁶). One data point with total transcript > 30,000 is not shown on this plot. P. reichenowi dN/dS estimates were also correlated with total protein levels (Fig S2).
Figure 2
Figure 2. Evolutionary rates vary with developmental stage
P. reichenowi dN/dS distributions of genes grouped by developmental expression. Red horizontal lines indicate the median dN/dS of all plotted genes. Box middle line upper and lower limits indicate the median, upper and lower quartiles. Box widths are proportional to group size. Developmental stages include sporozoite (Sp), merozoite (Mz), schizont (Sc), ring stage (Rg), trophozoite (Tr) and Gametocyte (Gc) and gamete stage (Ge). a, b. Developmental expression Genes grouped by both developmental stage and the number of developmental stages they are expressed in (1-6). Transcript expression data (a) or protein expression data (b) was used to group genes that were ‘present’ in the various stages (≥10% of the genes expression in the stage concerned, see Supplementary Methods). dN/dS distributions of developmental stage groups, do not differ from one another (Kruskal-Wallis, transcript P = 0.11, protein P = 0.35) (open boxes), but the dN/dS distributions duration of expression groups (number of stages) do differ significantly (Kruskal-Wallis, transcript P = 5.05×10⁻¹⁵, protein P = 2.6×10⁻⁴) (grey boxes). c. Principal developmental stage (transcript data) Genes that were primarily present in one developmental stage (≥50% of the genes expression, data from13) were grouped. Ring-stage transcripts have the highest P. reichenowi dN/dS distribution (Mann-Whitney, P = 2.2×10⁻³). Consistent relative differences in evolutionary rates between stage-specific genes were observed with protein data, and another microarray study (Figure S3).
Figure 3
Figure 3. Evolutionary rate in the context of gene function
P. reichenowi dN/dS distributions of genes grouped by protein function. Plots drawn as Fig. 2. a. Intraerythrocyte developmental cycle (IDC) Temporal and functional IDC groups are; transcription (1), cytoplasmic translation (2), glycolysis (3), ribonucleotide synthesis (4), deoxyribonucleotide synthesis (5), DNA replication (6), TCA cycle (7), proteosome (8), merozoite invasion (9), actin/myosin motors (10), early ring transcripts (11), mitochondria (12), organelle translation (13). Merozoite invasion (9) and early ring cluster (11) showed significantly elevated dN/dS distributions (Mann-Whitney, P = 1.7×10⁻⁵ and P = 0.024). b. Cellular localisation Genes grouped according to Gene Ontology localisation, and predicted export motif. All groups had significantly different dN/dS distributions. Categories (and Mann-Whitney test P values) are; nucleus (Nuc, P < 2.2×10⁻¹⁶), apicoplast (Api, P = 0.013), mitochondria (Mit, P = 1.238×10⁻⁹), cytoplasm (Cyt, P = 7.283×10⁻⁸), membrane-spanning (Mem, P < 2.2×10⁻¹⁶), exported (Exp, P = 1.776×10⁻¹⁵). c. Gene Ontology GO-slim categories with significantly different dN/dS distribution (compared to all genes not in category) are shown. Categories showing significantly lower dN/dS distributions were intracellular transport (IT), carbohydrate metabolism (CM), cell cycle (CY), transport (TR), nucleobase, nucleoside, nucleotide and nucleic acid metabolism (NM), regulation of cellular physiological process (RE), cell organization and biogenesis (CB), macromolecule metabolism (MM), protein metabolism (PM), cellular metabolism (CL). Cell communication (CC) and entry into host cell (EH) had significantly higher dN/dS distributions (Mann-Whitney, P = 2.0×10⁻³ and P = 0.043).

Comment in

  • Toward a malaria haplotype map.
    Carlton JM. Carlton JM. Nat Genet. 2007 Jan;39(1):5-6. doi: 10.1038/ng0107-5. Nat Genet. 2007. PMID: 17192778 No abstract available.

References

    1. Korenromp E, Miller J, Nahlen B, Wardlaw T, Young M. World Malaria Report 2005. World Health Organization, Roll Back Malaria, Department and the United Nations Children's Fund. 2005
    1. Mu J, et al. Chromosome-wide SNPs reveal an ancient origin for Plasmodium falciparum. Nature. 2002;418:323–6. - PubMed
    1. Anderson TJ. Mapping drug resistance genes in Plasmodium falciparum by genome-wide association. Curr Drug Targets Infect Disord. 2004;4:65–78. - PubMed
    1. Gardner MJ, et al. Genome sequence of the human malaria parasite Plasmodium falciparum. Nature. 2002;419:498–511. - PMC - PubMed
    1. Ning Z, Cox AJ, Mullikin JC. SSAHA: a fast search method for large DNA databases. Genome Res. 2001;11:1725–9. - PMC - PubMed

Publication types