

Vibrational microscopy and imaging of skin: from single cells to intact tissue
- PMID: 17160382
- PMCID: PMC1802726
- DOI: 10.1007/s00216-006-0852-0
Vibrational microscopy and imaging of skin: from single cells to intact tissue
Abstract
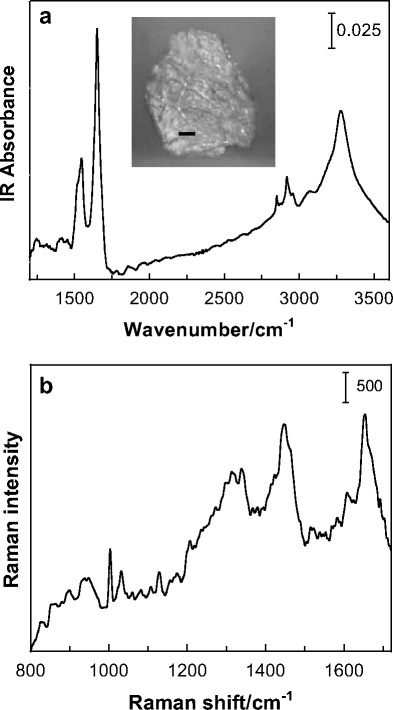
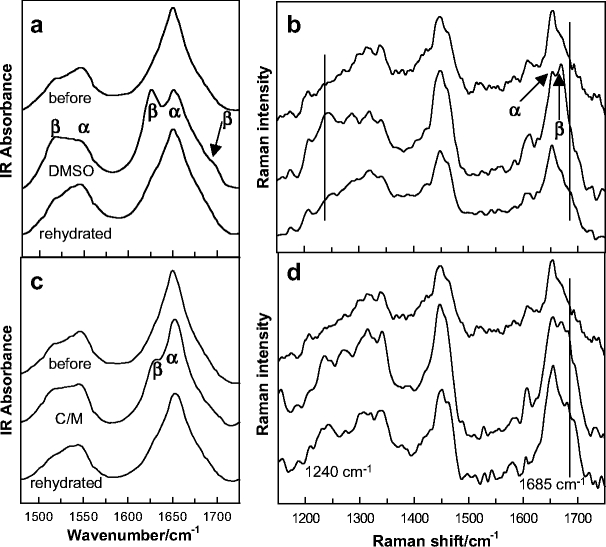
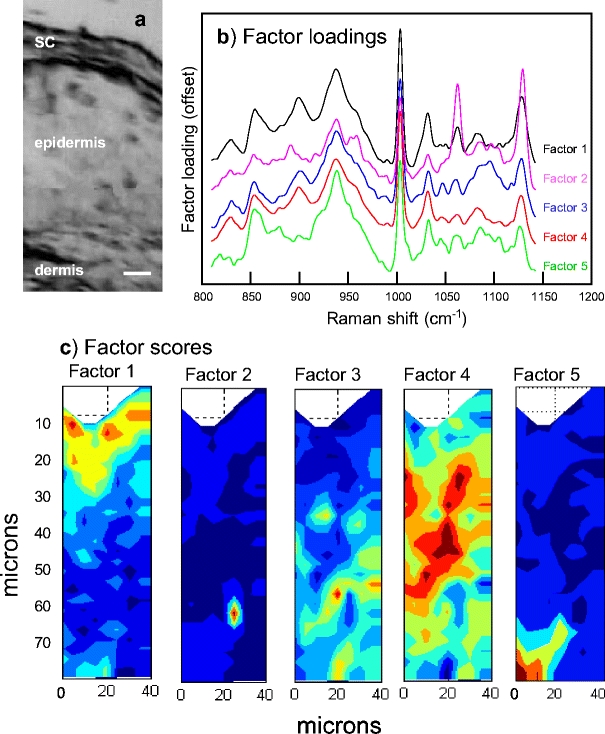
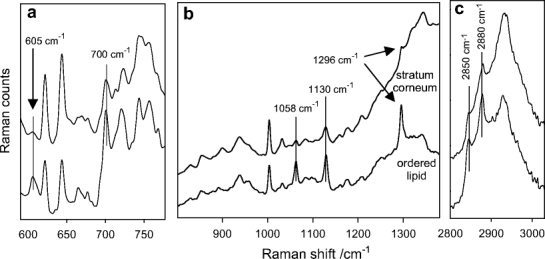
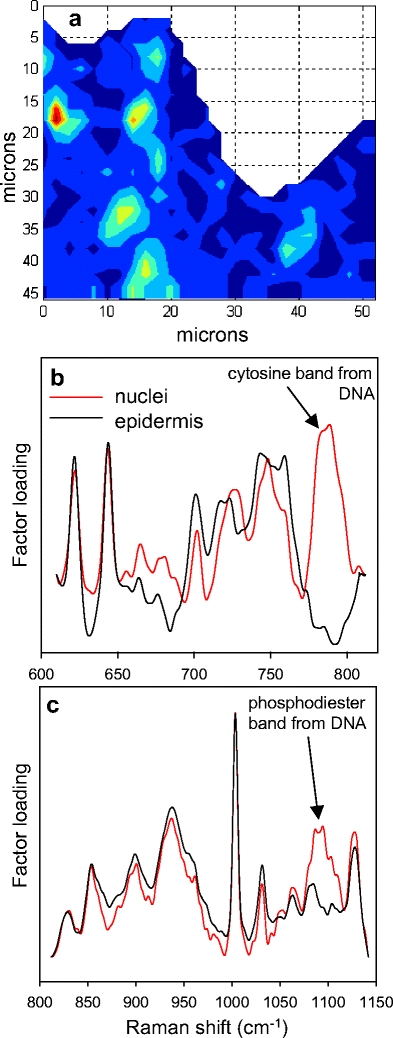
Vibrational microscopy and imaging offer several advantages for a variety of dermatological applications, ranging from studies of isolated single cells (corneocytes) to characterization of endogenous components in intact tissue. Two applications are described to illustrate the power of these techniques for skin research. First, the feasibility of tracking structural alterations in the components of individual corneocytes is demonstrated. Two solvents, DMSO and chloroform/methanol, commonly used in dermatological research, are shown to induce large reversible alterations (alpha-helix to beta-sheet) in the secondary structure of keratin in isolated corneocytes. Second, factor analysis of image planes acquired with confocal Raman microscopy to a depth of 70 microm in intact pigskin, demonstrates the delineation of specific skin regions. Two particular components that are difficult to identify by other means were observed in the epidermis. One small region was formed from a conformationally ordered lipid phase containing cholesterol. In addition, the presence of nucleated cells in the tissue (most likely keratinocytes) was revealed by the spectral signatures of the phosphodiester and cytosine moieties of cellular DNA.
Figures
Similar articles
-
Imaging the prodrug-to-drug transformation of a 5-fluorouracil derivative in skin by confocal Raman microscopy.J Invest Dermatol. 2007 May;127(5):1205-9. doi: 10.1038/sj.jid.5700690. Epub 2007 Jan 11. J Invest Dermatol. 2007. PMID: 17218938
-
Uncertainties in depth determination and comparison of multivariate with univariate analysis in confocal Raman studies of a laminated polymer and skin.Appl Spectrosc. 2004 Apr;58(4):382-9. doi: 10.1366/000370204773580202. Appl Spectrosc. 2004. PMID: 15104806
-
Infrared and Raman imaging spectroscopy of ex vivo skin.Int J Cosmet Sci. 2013 Apr;35(2):125-35. doi: 10.1111/ics.12020. Epub 2012 Nov 29. Int J Cosmet Sci. 2013. PMID: 23106608
-
Vibrational spectroscopic methods for cytology and cellular research.Analyst. 2014 Sep 21;139(18):4411-44. doi: 10.1039/c4an00636d. Analyst. 2014. PMID: 25028699 Review.
-
Confocal Raman microspectroscopy of the skin.Eur J Dermatol. 2011 Nov-Dec;21(6):851-63. doi: 10.1684/ejd.2011.1494. Eur J Dermatol. 2011. PMID: 21914580 Review.
Cited by
-
Raman spectroscopy in biomedicine - non-invasive in vitro analysis of cells and extracellular matrix components in tissues.Biotechnol J. 2013 Mar;8(3):288-97. doi: 10.1002/biot.201200163. Epub 2012 Nov 19. Biotechnol J. 2013. PMID: 23161832 Free PMC article. Review.
-
Development of a Novel Perfusion Rotating Wall Vessel Bioreactor with Ultrasound Stimulation for Mass-Production of Mineralized Tissue Constructs.Tissue Eng Regen Med. 2022 Aug;19(4):739-754. doi: 10.1007/s13770-022-00447-3. Epub 2022 May 9. Tissue Eng Regen Med. 2022. PMID: 35532736 Free PMC article.
-
Narrowband-autofluorescence imaging for bone analysis.Biomed Opt Express. 2019 Apr 11;10(5):2367-2382. doi: 10.1364/BOE.10.002367. eCollection 2019 May 1. Biomed Opt Express. 2019. PMID: 31149377 Free PMC article.
-
Tracking the dephosphorylation of resveratrol triphosphate in skin by confocal Raman microscopy.J Control Release. 2007 Nov 6;123(2):141-7. doi: 10.1016/j.jconrel.2007.08.001. Epub 2007 Aug 15. J Control Release. 2007. PMID: 17826862 Free PMC article.
-
Keratin-water-NMF interaction as a three layer model in the human stratum corneum using in vivo confocal Raman microscopy.Sci Rep. 2017 Nov 21;7(1):15900. doi: 10.1038/s41598-017-16202-x. Sci Rep. 2017. PMID: 29162917 Free PMC article.
References
-
- {'text': '', 'ref_index': 1, 'ids': [{'type': 'DOI', 'value': '10.1359/JBMR.040820', 'is_inner': False, 'url': 'https://doi.org/10.1359/jbmr.040820'}, {'type': 'PMC', 'value': 'PMC1456071', 'is_inner': False, 'url': 'https://pmc.ncbi.nlm.nih.gov/articles/PMC1456071/'}, {'type': 'PubMed', 'value': '15537443', 'is_inner': True, 'url': 'https://pubmed.ncbi.nlm.nih.gov/15537443/'}]}
- Paschalis EP, Shane E, Lyritis C, Skarantavos G, Mendelsohn R, Boskey AL (2004) J Bone Miner Res 19:2000–2004 - PMC - PubMed
-
-
{'text': '', 'ref_index': 1, 'ids': [{'type': 'DOI', 'value': '10.1002/(SICI)1520-6343(1998)4:5+
- Caspers PJ, Lucassen GW, Wolthuis R, Bruining HA, Puppels GJ (1998) Biospectroscopy 4:S31–S39 - PubMed
-
{'text': '', 'ref_index': 1, 'ids': [{'type': 'DOI', 'value': '10.1002/(SICI)1520-6343(1998)4:5+
-
- {'text': '', 'ref_index': 1, 'ids': [{'type': 'DOI', 'value': '10.1023/A:1020481305420', 'is_inner': False, 'url': 'https://doi.org/10.1023/a:1020481305420'}, {'type': 'PubMed', 'value': '12425479', 'is_inner': True, 'url': 'https://pubmed.ncbi.nlm.nih.gov/12425479/'}]}
- Caspers PJ, Williams AC, Carter EA, Edwards HG, Barry BW, Bruining HA, Puppels GJ (2002) Pharm Res 19:1577–1580 - PubMed
-
- {'text': '', 'ref_index': 1, 'ids': [{'type': 'DOI', 'value': '10.1111/j.0022-202X.2004.23608.x', 'is_inner': False, 'url': 'https://doi.org/10.1111/j.0022-202x.2004.23608.x'}, {'type': 'PubMed', 'value': '15737204', 'is_inner': True, 'url': 'https://pubmed.ncbi.nlm.nih.gov/15737204/'}]}
- Xiao C, Moore DJ, Rerek ME, Flach CR, Mendelsohn R (2005) J Invest Dermatol 124:622–632 - PubMed
-
- {'text': '', 'ref_index': 1, 'ids': [{'type': 'DOI', 'value': '10.1366/000370204773580202', 'is_inner': False, 'url': 'https://doi.org/10.1366/000370204773580202'}, {'type': 'PubMed', 'value': '15104806', 'is_inner': True, 'url': 'https://pubmed.ncbi.nlm.nih.gov/15104806/'}]}
- Xiao C, Flach CR, Marcott C, Mendelsohn R (2004) Appl Spectrosc 58:382–389 - PubMed
Publication types
MeSH terms
Substances
Grants and funding
LinkOut - more resources
Full Text Sources
