Genotype x adiposity interaction linkage analyses reveal a locus on chromosome 1 for lipoprotein-associated phospholipase A2, a marker of inflammation and oxidative stress
- PMID: 17160904
- PMCID: PMC1785310
- DOI: 10.1086/510497
Genotype x adiposity interaction linkage analyses reveal a locus on chromosome 1 for lipoprotein-associated phospholipase A2, a marker of inflammation and oxidative stress
Abstract
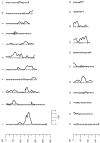
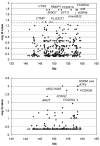
Because obesity leads to a state of chronic, low-grade inflammation and oxidative stress, we hypothesized that the contribution of genes to variation in a biomarker of these two processes may be influenced by the degree of adiposity. We tested this hypothesis using samples from the San Antonio Family Heart Study that were assayed for activity of lipoprotein-associated phospholipase A(2) (Lp-PLA(2)), a marker of inflammation and oxidative stress. Using an approach to model discrete genotypexenvironment (GxE) interaction, we assigned individuals to one of two discrete diagnostic states (or "adiposity environments"): nonobese or obese, according to criteria suggested by the World Health Organization. We found a genomewide maximum LOD of 3.39 at 153 cM on chromosome 1 for Lp-PLA(2). Significant GxE interaction for Lp-PLA(2) at the genomewide maximum (P=1.16 x 10(-4)) was also found. Microarray gene-expression data were analyzed within the 1-LOD interval of the linkage signal on chromosome 1. We found two transcripts--namely, for Fc gamma receptor IIA and heat-shock protein (70 kDa)--that were significantly associated with Lp-PLA(2) (P<.001 for both) and showed evidence of cis-regulation with nominal LOD scores of 2.75 and 13.82, respectively. It would seem that there is a significant genetic response to the adiposity environment in this marker of inflammation and oxidative stress. Additionally, we conclude that GxE interaction analyses can improve our ability to identify and localize quantitative-trait loci.
Figures


Similar articles
-
Clinical and genetic factors associated with lipoprotein-associated phospholipase A2 in the Framingham Heart Study.Atherosclerosis. 2009 Jun;204(2):601-7. doi: 10.1016/j.atherosclerosis.2008.10.030. Epub 2008 Nov 5. Atherosclerosis. 2009. PMID: 19135199 Free PMC article.
-
Effects of V279F in the Lp-PLA(2) gene on markers of oxidative stress and inflammation in Koreans.Clin Chim Acta. 2010 Apr 2;411(7-8):486-93. doi: 10.1016/j.cca.2009.12.021. Epub 2010 Jan 18. Clin Chim Acta. 2010. PMID: 20080080
-
Genotype-by-diet effects on co-variation in Lp-PLA2 activity and LDL-cholesterol concentration in baboons fed an atherogenic diet.J Lipid Res. 2008 Jun;49(6):1295-302. doi: 10.1194/jlr.M800020-JLR200. Epub 2008 Mar 11. J Lipid Res. 2008. PMID: 18334716 Free PMC article.
-
The role of lipoprotein-associated phospholipase A2 as a marker for atherosclerosis.Curr Atheroscler Rep. 2007 Aug;9(2):97-103. doi: 10.1007/s11883-007-0004-9. Curr Atheroscler Rep. 2007. PMID: 17877917 Review.
-
The role of lipoprotein-associated phospholipase A2 (Lp-PLA₂) in cardiovascular disease.Rev Recent Clin Trials. 2011 May;6(2):108-13. doi: 10.2174/157488711795177903. Rev Recent Clin Trials. 2011. PMID: 21241231 Review.
Cited by
-
A pleiotropic QTL on 2p influences serum Lp-PLA2 activity and LDL cholesterol concentration in a baboon model for the genetics of atherosclerosis risk factors.Atherosclerosis. 2008 Feb;196(2):667-73. doi: 10.1016/j.atherosclerosis.2007.07.014. Epub 2007 Sep 4. Atherosclerosis. 2008. PMID: 17767937 Free PMC article.
-
Clinical and genetic factors associated with lipoprotein-associated phospholipase A2 in the Framingham Heart Study.Atherosclerosis. 2009 Jun;204(2):601-7. doi: 10.1016/j.atherosclerosis.2008.10.030. Epub 2008 Nov 5. Atherosclerosis. 2009. PMID: 19135199 Free PMC article.
-
Sex-specific genetic architecture of human fatness in Chinese: the SAPPHIRe Study.Hum Genet. 2010 Nov;128(5):501-13. doi: 10.1007/s00439-010-0877-5. Epub 2010 Aug 20. Hum Genet. 2010. PMID: 20725740 Free PMC article.
-
Genotype by sex and genotype by age interactions with sedentary behavior: the Portuguese Healthy Family Study.PLoS One. 2014 Oct 10;9(10):e110025. doi: 10.1371/journal.pone.0110025. eCollection 2014. PLoS One. 2014. PMID: 25302714 Free PMC article.
-
Mapping quantitative traits in unselected families: algorithms and examples.Genet Epidemiol. 2009 Nov;33(7):617-27. doi: 10.1002/gepi.20413. Genet Epidemiol. 2009. PMID: 19278016 Free PMC article.
References
Web Resources
-
- Human (Homo sapiens) Genome Browser Gateway, http://genome.ucsc.edu/cgi-bin/hgGateway (for physical distances)
-
- NCBI, http://www.ncbi.nlm.nih.gov/ (for the physical location of the transcripts)
-
- Online Mendelian Inheritance in Man (OMIM), http://www.ncbi.nlm.nih.gov/Omim/ (for FCGR2A and HSPA6)
-
- Q Value, http://faculty.washington.edu/~jstorey/qvalue/ (for a free software download)
-
- SOLAR, http://www.sfbr.org/solar/index.html (for a free software download)
References
Publication types
MeSH terms
Substances
Grants and funding
LinkOut - more resources
Full Text Sources

