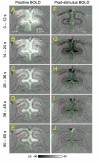
Improved spatial localization of post-stimulus BOLD undershoot relative to positive BOLD
- PMID: 17161623
- PMCID: PMC1876719
- DOI: 10.1016/j.neuroimage.2006.10.016
Improved spatial localization of post-stimulus BOLD undershoot relative to positive BOLD
Abstract
The negative blood oxygenation level-dependent (BOLD) signal following the cessation of stimulation (post-stimulus BOLD undershoot) is observed in functional magnetic resonance imaging (fMRI) studies. However, its spatial characteristics are unknown. To investigate this, gradient-echo BOLD fMRI in response to visual stimulus was obtained in isoflurane-anesthetized cats at 9.4 T. Since the middle cortical layer (layer 4) is known to have the highest metabolic and cerebral blood volume (CBV) responses, images were obtained to view the cortical cross-section. Robust post-stimulus BOLD undershoot was observed in all studies, and lasted longer than 30 s after the cessation of 40-60 s stimulation. The magnitude of post-stimulus BOLD undershoot was linearly dependent on echo time with little intercept when extrapolating to TE = 0, indicating that the T2* change is the major cause of the BOLD undershoot. The post-stimulus BOLD undershoot was observed within the cortex and near the surface of the cortex, while the prolonged CBV elevation was observed only at the middle of the cortex. Within the cortex, the largest post-stimulus undershoot was detected at the middle of the cortex, similar to the CBV increase during the stimulation period. Our findings demonstrate that, even though there is significant contribution from pial vessel signals, the post-stimulus undershoot BOLD signal is useful to improve the spatial localization of fMRI to active cortical sites.
Figures


Comment in
-
Anaesthetic use in animal models for neuroimaging.Neuroimage. 2007 Oct 15;38(1):1-2; discussion 3-4. doi: 10.1016/j.neuroimage.2007.04.022. Epub 2007 Apr 19. Neuroimage. 2007. PMID: 17532229 No abstract available.
Similar articles
-
Origins of the BOLD post-stimulus undershoot.Neuroimage. 2009 Jul 1;46(3):559-68. doi: 10.1016/j.neuroimage.2009.03.015. Epub 2009 Mar 19. Neuroimage. 2009. PMID: 19303450
-
Cortical layer-dependent dynamic blood oxygenation, cerebral blood flow and cerebral blood volume responses during visual stimulation.Neuroimage. 2008 Oct 15;43(1):1-9. doi: 10.1016/j.neuroimage.2008.06.029. Epub 2008 Jul 4. Neuroimage. 2008. PMID: 18655837 Free PMC article.
-
Neural activity-induced modulation of BOLD poststimulus undershoot independent of the positive signal.Magn Reson Imaging. 2009 Oct;27(8):1030-8. doi: 10.1016/j.mri.2009.04.003. Magn Reson Imaging. 2009. PMID: 19761930
-
Linking brain vascular physiology to hemodynamic response in ultra-high field MRI.Neuroimage. 2018 Mar;168:279-295. doi: 10.1016/j.neuroimage.2017.02.063. Epub 2017 Feb 22. Neuroimage. 2018. PMID: 28254456 Review.
-
Comparison of block and event-related experimental designs in diffusion-weighted functional MRI.J Magn Reson Imaging. 2014 Aug;40(2):367-75. doi: 10.1002/jmri.24353. Epub 2013 Oct 29. J Magn Reson Imaging. 2014. PMID: 24923816 Review.
Cited by
-
Exploring the post-stimulus undershoot with spin-echo fMRI: implications for models of neurovascular response.Hum Brain Mapp. 2011 Jan;32(1):141-53. doi: 10.1002/hbm.21003. Hum Brain Mapp. 2011. PMID: 20623748 Free PMC article.
-
Physiological origin for the BOLD poststimulus undershoot in human brain: vascular compliance versus oxygen metabolism.J Cereb Blood Flow Metab. 2011 Jul;31(7):1599-611. doi: 10.1038/jcbfm.2011.35. Epub 2011 Apr 6. J Cereb Blood Flow Metab. 2011. PMID: 21468090 Free PMC article.
-
Foundations of layer-specific fMRI and investigations of neurophysiological activity in the laminarized neocortex and olfactory bulb of animal models.Neuroimage. 2019 Oct 1;199:718-729. doi: 10.1016/j.neuroimage.2017.05.023. Epub 2017 May 12. Neuroimage. 2019. PMID: 28502845 Free PMC article. Review.
-
Non-invasive quantification of absolute cerebral blood volume during functional activation applicable to the whole human brain.Magn Reson Med. 2014 Feb;71(2):580-90. doi: 10.1002/mrm.24694. Magn Reson Med. 2014. PMID: 23475774 Free PMC article.
-
Tracking the effects of crusher gradients on gradient-echo BOLD signal in space and time during rat sensory stimulation.Magn Reson Med. 2008 Sep;60(3):548-54. doi: 10.1002/mrm.21666. Magn Reson Med. 2008. PMID: 18727038 Free PMC article.
References
-
- Ances BM, Buerk DG, Greenberg JH, Detre JA. Temporal dynamics of the partial pressure of brain tissue oxygen during functional forepaw stimulation in rats. Neurosci Lett. 2001;306:106–110. - PubMed
-
- Buxton RB, Wong EC, Frank LR. Dynamics of blood flow and oxygenation changes during brain activation: The baloon model. Magn Reson Med. 1998;39:855–864. - PubMed
-
- Cohen ER, Ugurbil K, Kim S-G. Effect of basal conditions on the magnitude and dynamics of the blood oxygenation-level dependent fMRI response. J Cereb Blood Flow and Metab. 2002;22:1042–1053. - PubMed
-
- Duong TQ, Kim D-S, Ugurbil K, Kim S-G. Spatiotemporal Dynamics of the BOLD fMRI Signals: Toward Mapping Submillimeter Cortical Columns Using the Early Negative Response. Magn Reson Med. 2000a;44:231–242. - PubMed
Publication types
MeSH terms
Grants and funding
LinkOut - more resources
Full Text Sources
Medical
Miscellaneous

