

Prediction of fluid responsiveness using respiratory variations in left ventricular stroke area by transoesophageal echocardiographic automated border detection in mechanically ventilated patients
- PMID: 17163985
- PMCID: PMC1794488
- DOI: 10.1186/cc5123
Prediction of fluid responsiveness using respiratory variations in left ventricular stroke area by transoesophageal echocardiographic automated border detection in mechanically ventilated patients
Abstract
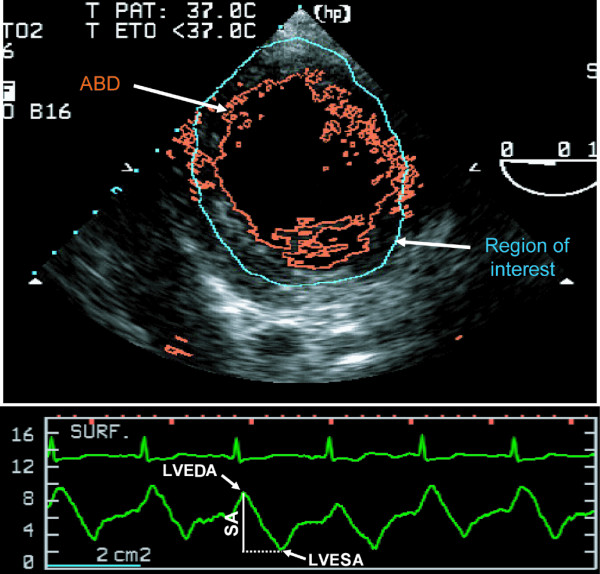
Background: Left ventricular stroke area by transoesophageal echocardiographic automated border detection has been shown to be strongly correlated to left ventricular stroke volume. Respiratory variations in left ventricular stroke volume or its surrogates are good predictors of fluid responsiveness in mechanically ventilated patients. We hypothesised that respiratory variations in left ventricular stroke area (DeltaSA) can predict fluid responsiveness.
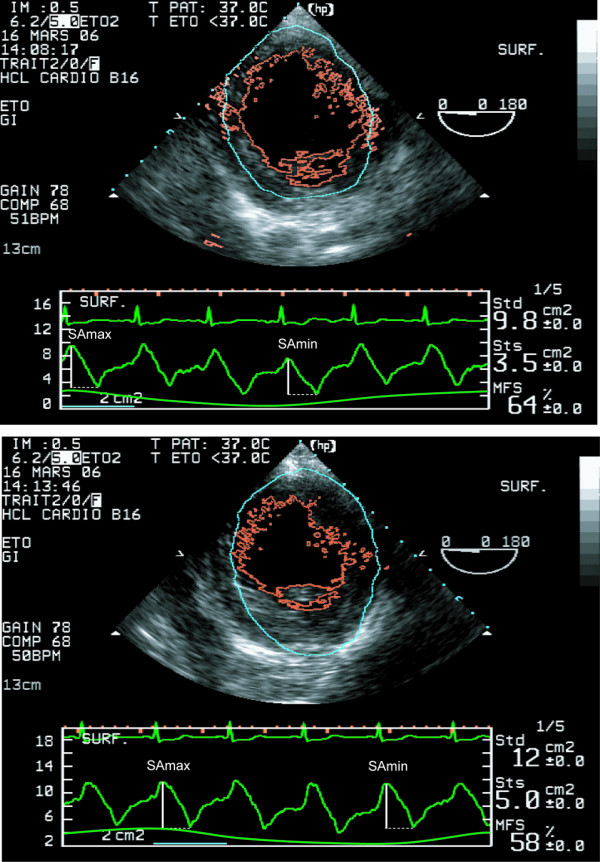
Methods: Eighteen mechanically ventilated patients undergoing coronary artery bypass grafting were studied immediately after induction of anaesthesia. Stroke area was measured on a beat-to-beat basis using transoesophageal echocardiographic automated border detection. Haemodynamic and echocardiographic data were measured at baseline and after volume expansion induced by a passive leg raising manoeuvre. Responders to passive leg raising manoeuvre were defined as patients presenting a more than 15% increase in cardiac output.
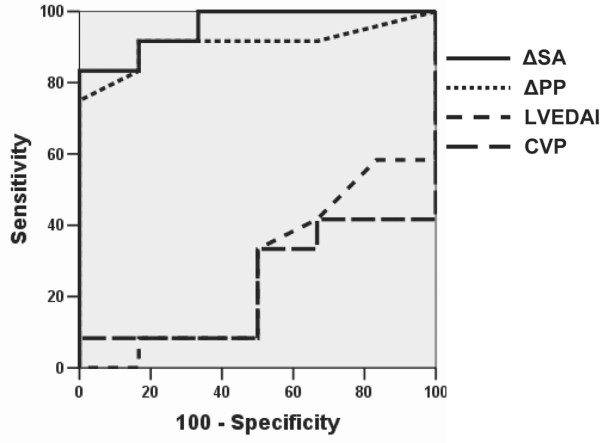
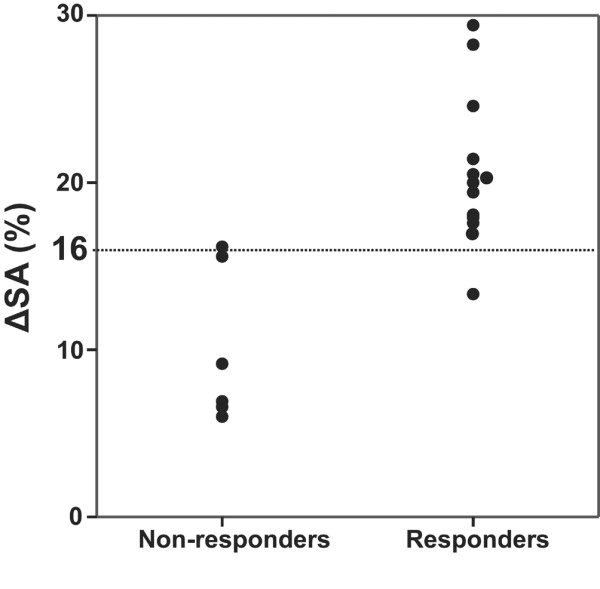
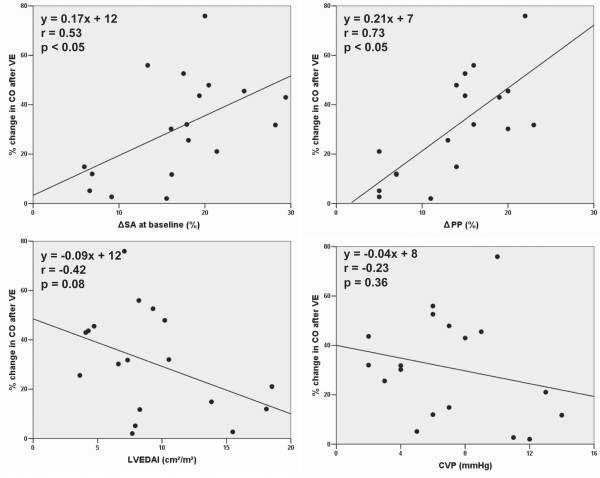
Results: Cardiac output increased significantly in response to volume expansion induced by passive leg raising (from 2.16 +/- 0.79 litres per minute to 2.78 +/- 1.08 litres per minute; p < 0.01). DeltaSA decreased significantly in response to volume expansion (from 17% +/- 7% to 8% +/- 6%; p < 0.01). DeltaSA was higher in responders than in non-responders (20% +/- 5% versus 10% +/- 5%; p < 0.01). A cutoff DeltaSA value of 16% allowed fluid responsiveness prediction with a sensitivity of 92% and a specificity of 83%. DeltaSA at baseline was related to the percentage increase in cardiac output in response to volume expansion (r = 0.53, p < 0.01).
Conclusion: DeltaSA by transoesophageal echocardiographic automated border detection is sensitive to changes in preload, can predict fluid responsiveness, and can quantify the effects of volume expansion on cardiac output. It has potential clinical applications.
Figures
Comment in
-
Echocardiography and assessing fluid responsiveness: acoustic quantification again into the picture?Crit Care. 2007;11(1):105. doi: 10.1186/cc5140. Crit Care. 2007. PMID: 17274831 Free PMC article.
Similar articles
-
Prediction of fluid responsiveness in acute respiratory distress syndrome patients ventilated with low tidal volume and high positive end-expiratory pressure.Crit Care Med. 2008 Oct;36(10):2810-6. doi: 10.1097/CCM.0b013e318186b74e. Crit Care Med. 2008. PMID: 18766099
-
Usefulness of left ventricular stroke volume variation to assess fluid responsiveness in patients with reduced cardiac function.Crit Care Med. 2003 May;31(5):1399-404. doi: 10.1097/01.CCM.0000059442.37548.E1. Crit Care Med. 2003. PMID: 12771609
-
Passive leg raising is predictive of fluid responsiveness in spontaneously breathing patients with severe sepsis or acute pancreatitis.Crit Care Med. 2010 Mar;38(3):819-25. doi: 10.1097/CCM.0b013e3181c8fe7a. Crit Care Med. 2010. PMID: 20016380
-
Volume responsiveness.Curr Opin Crit Care. 2007 Oct;13(5):549-53. doi: 10.1097/MCC.0b013e3282ec68b2. Curr Opin Crit Care. 2007. PMID: 17762234 Review.
-
Emerging trends in minimally invasive haemodynamic monitoring and optimization of fluid therapy.Eur J Anaesthesiol. 2009 Nov;26(11):893-905. doi: 10.1097/EJA.0b013e3283308e50. Eur J Anaesthesiol. 2009. PMID: 19667998 Review.
Cited by
-
Predicting and measuring fluid responsiveness with echocardiography.Echo Res Pract. 2016 Jun;3(2):G1-G12. doi: 10.1530/ERP-16-0008. Epub 2016 May 24. Echo Res Pract. 2016. PMID: 27249550 Free PMC article.
-
Echocardiography and assessing fluid responsiveness: acoustic quantification again into the picture?Crit Care. 2007;11(1):105. doi: 10.1186/cc5140. Crit Care. 2007. PMID: 17274831 Free PMC article.
-
Respiratory pulse pressure variation fails to predict fluid responsiveness in acute respiratory distress syndrome.Crit Care. 2011;15(2):R85. doi: 10.1186/cc10083. Epub 2011 Mar 7. Crit Care. 2011. PMID: 21385348 Free PMC article.
-
Year in review 2006: Critical Care--Cardiology.Crit Care. 2007;11(4):225. doi: 10.1186/cc5978. Crit Care. 2007. PMID: 17764587 Free PMC article. Review.
-
Echocardiography practice, training and accreditation in the intensive care: document for the World Interactive Network Focused on Critical Ultrasound (WINFOCUS).Cardiovasc Ultrasound. 2008 Oct 6;6:49. doi: 10.1186/1476-7120-6-49. Cardiovasc Ultrasound. 2008. PMID: 18837986 Free PMC article.
