The use of proteomics in identifying differentially expressed serum proteins in humans with type 2 diabetes
- PMID: 17163994
- PMCID: PMC1716156
- DOI: 10.1186/1477-5956-4-22
The use of proteomics in identifying differentially expressed serum proteins in humans with type 2 diabetes
Abstract
Background: The aim of the study was to optimize protocols for finding and identifying serum proteins that are differentially expressed in persons with normal glucose tolerance (NGT) compared to individuals with type 2 diabetes mellitus (T2DM). Serum from persons with NGT and persons with T2DM was profiled using ProteinChip arrays and time-of-flight mass spectra were generated by surface enhanced laser desorption/ionization time-of-flight mass spectrometry (SELDI-TOF MS).
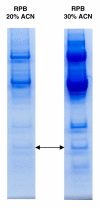
Results: Mass spectra from NGT- and T2DM-groups were compared. Fifteen proteins ranging from 5 to 79 kDa were differentially expressed (p < 0.05). Five of these proteins showed decreased and ten showed increased serum levels in individuals with T2DM. To be able to identify the proteins, the complexity of the sample was reduced by fractionation approaches. Subsequently, the purified fractions containing biomarkers were separated by one-dimensional SDS-polyacrylamide gel electrophoresis (SDS-PAGE) in two identical lanes. Protein bands of the first lane were excised and subjected to passive elution to recapture the biomarkers on ProteinChip arrays. The corresponding bands of the second lane were subjected to peptide-mass fingerprinting (PMF). Using this approach four of the differentially expressed proteins were identified as apolipoprotein C3 (9.4 kDa), transthyretin (13.9 kDa), albumin (66 kDa) and transferrin (79 kDa). Whereas apolipoprotein C3 and transthyretin were up-regulated, albumin and transferrin were down-regulated in T2DM.
Conclusion: Protocols for protein profiling by SELDI-TOF MS and protein identification by fractionation, SDS-PAGE and PMF were optimized for serum from humans with T2DM. With these protocols differentially expressed proteins were discovered and identified when serum from NGT- and T2DM-individuals was analyzed.
Figures


References
-
- Mitrakou A, Kelley D, Mokan M, Veneman T, Pangburn T, Reilly J, Gerich J. Role of reduced suppression of glucose production and diminished early insulin release in impaired glucose tolerance. N Engl J Med. 1992;326:22–29. - PubMed
-
- Cerasi E, Luft R. The plasma insulin response to glucose infusion in healthy subjects and in diabetes mellitus. Acta Endocrinol (Copenh) 1967;55:278–304. - PubMed
LinkOut - more resources
Full Text Sources
Other Literature Sources
Research Materials
Miscellaneous

