. 2007 Feb;13(2):211-22.
doi: 10.1261/rna.307907. Epub 2006 Dec 12.

An allosteric-feedback mechanism for protein-assisted group I intron splicing

Affiliations

An allosteric-feedback mechanism for protein-assisted group I intron splicing

Mark G Caprara et al. RNA. 2007 Feb.

Abstract

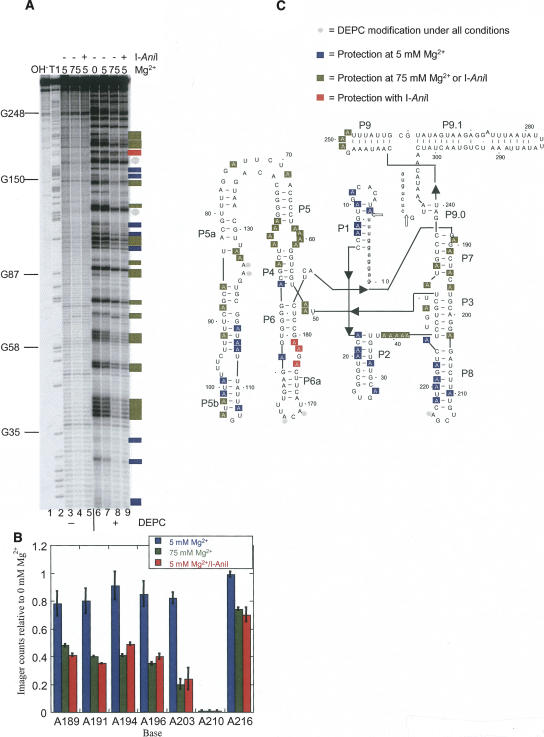
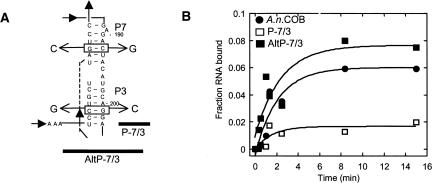
The I-AniI maturase facilitates self-splicing of a mitochondrial group I intron in Aspergillus nidulans. Binding occurs in at least two steps: first, a specific but labile encounter complex rapidly forms and then this intermediate is slowly resolved into a native, catalytically active RNA/protein complex. Here we probe the structure of the RNA throughout the assembly pathway. Although inherently unstable, the intron core, when bound by I-AniI, undergoes rapid folding to a near-native state in the encounter complex. The next transition includes the slow destabilization and docking into the core of the peripheral stacked helix that contains the 5' splice site. Mutational analyses confirm that both transitions are important for native complex formation. We propose that protein-driven destabilization and docking of the peripheral stacked helix lead to subtle changes in the I-AniI binding site that facilitate native complex formation. These results support an allosteric-feedback mechanism of RNA-protein recognition in which proteins engaged in an intermediate complex can influence RNA structure far from their binding sites. The linkage of these changes to stable binding ensures that the protein and RNA do not get sequestered in nonfunctional complexes.


Figures

FIGURE 1.
FIGURE 1.
Chemical structure mapping of the A.n. COB pre-RNA. (A) DEPC modification of end-labeled RNA. End-labeled A.n. COB was treated with DEPC in various concentrations of Mg2+ as well as in the presence of I-AniI. Sites of modification were cleaved by treatment with aniline and the products separated by denaturing gel electrophoresis. Lane 1, hydrolysis ladder; lane 2, G sequencing by partial T1 digestion; lanes 3–5, mock-treated RNA; lanes 6–9, DEPC-treated RNAs; lane 6, 0 mM Mg2+, lanes 3 and 7, 5 mM Mg2+; lanes 4 and 8, 75 mM Mg2+; lanes 5 and 9, 5 mM Mg2+ plus I-AniI. (B) Quantification of the DEPC mapping data encompassing the P7–P8 region. PhosophorImager counts in each lane were normalized and expressed as a ratio relative to 0 mM Mg2+. The histogram shows averaged ratios with the error bars representing standard deviations. (C) Secondary structure model of A.n. COB pre-RNA showing positions of DEPC modification or protection. Open arrows point to splice sites. Two independent DEPC mapping experiments were performed, and positions were scored as protected on the secondary structure model if a twofold or greater reduction in modification level relative to 0 mM Mg2+ was observed in both experiments. The state of modification for unmarked positions could not be assigned because of inconsistencies between experiments, degradation, or poor resolution in the gel. For the A.n. COB intron, adenines in single-stranded regions expected to make specific contacts to orient the four domains in a catalytically active conformation include (a) the A-rich bulge in P5a with the P4 helix; (b) the J3/4 and J6/7 junctions with P6 and P4 helices, respectively; (c) the P9 loop with the P5 helix; (d) the J4/5, J5/4, and J8/7 junctions with the 5′ SS containing P1 helix; and (e) the P2 loop with P8 helix.
FIGURE 2.
FIGURE 2.
Oligonucleotide accessibility of the A.n. COB pre-RNA. (A) Locations of DNA oligonucleotide complementarity on a secondary structure of A.n. COB pre-RNA. (B) Accessibility experiments. Internally labeled RNAs were incubated in buffer containing 5 mM Mg2+ for 10 min and then a mixture of oligonucleotide and RNase H was added. After 1 min, the reaction was quenched and the products separated by denaturing gel electrophoresis. The region where each DNA oligonucleotide hybridizes is listed at the top of each lane in the gel image. 3E, DNA oligonucleotide targeted to the 3′ exon.
FIGURE 3.
FIGURE 3.
Phosphate backbone probing of A.n. COB pre-RNA. (A) Portion of a gel showing iodine cleavage of phosphorothioate substituted RNAs. A.n. COB pre-RNA was transcribed in the presence of one phosphorothioate analog and its 5′ end labeled. A.n. COB RNAs were incubated in various concentrations of Mg2+ as well as in the presence of I-AniI and then subjected to cleavage with iodine. The products were separated by denaturing gel electrophoresis and quantified. Nucleotide numbers are indicated at the side of the gel and the identity of the phosophorothioate substitution at the top. Lanes 1, 6, 11, and 16, mock-treated RNA; lanes 2, 7, 12, and 17, 0 mM Mg2+; lanes 3, 8, 13, and 18, 5 mM Mg2+; lanes 4, 9, 14, and 19, 75 mM Mg2+; lanes 5, 10, 15, and 20, 5 mM Mg2+ plus I-AniI. (B) Example of the quantification of the iodine mapping data. The histogram shows PhosophorImager counts in each lane that were normalized and expressed as a ratio relative to 0 mM Mg2+. (C) Summary of iodine cleavage data on the secondary structure of A.n. COB pre-RNA. Colored shading shows condition-specific protections, and positions that are cleaved under all conditions are demarcated by a gray oval. Three independent experiments were performed, and positions were scored as protected if a twofold or greater reduction in iodine cleavage relative to 0 mM Mg2+ was observed in each experiment. The relative amount of cleavage for unmarked positions could not be assigned because of inconsistencies between experiments, degradation, or poor resolution in the gel. Regions expected to be within a solvent inaccessible core include J3/4, J4/5, J5/4, J6/7, J8/7, the A-rich bulge in P5a, and the P7 helix. A portion of the P9.1 helix is shown schematically. (D) Position of putative I-AniI binding sites on the three-dimensional structure of the Tetrahymena intron. Red shading includes protected phosphate residues that lie on one side of the intron core. Other I-AniI-specific protections (blue shading) are on the opposite side of this surface and are likely due to interactions with the P1 helix.
FIGURE 4.
FIGURE 4.
Mutations in P7 and P3 negatively affect binding. (A) Location of the mutations. Only the P7/3 helix is shown. P-7/3 has changes in P7 (C192G) and P3 (G201C) that disrupt base-pairing in the middle of both stems. Compensatory mutations in AltP-7/3 restore base-pairing in both helices. (B) Association kinetics for A.n. COB pre-RNA, P-7/3 and AltP-7/3. Internally labeled RNA was incubated with 4 nM protein, and at various times a molar excess of unlabeled A.n. COB pre-RNA was added to stop binding and the reactions filtered on nitrocellulose. The data were fit to a single exponential to obtain k obs. For three independent experiments, the k obs were: A.n. COB pre-RNA: 0.66 (±0.17) min−1, P-7/3: 0.31 (±0.1) min−1, and AltP-7/3: 0.56 (±0.17) min−1. The k obs at 4 nM I-AniI is essentially the same as measured previously [0.63 (±0.03) min−1; Solem et al. 2002].
FIGURE 5.
FIGURE 5.
Time-resolved mapping of I-AniI binding of A.n. COB pre-RNA. (A) Oligonucleotide accessibility. Internally labeled RNA was incubated with I-AniI for 10–300 sec and then probed by the addition of a DNA oligonucleotide and RNase H. Digestion occurred for 10 sec, the reaction quenched and products separated by denaturing polyacrylamide gel electrophoresis. The position of the oligonucleotide binding site is shown in Figure 2. SM, starting material; 0, no protein added. (B) Time-dependent RNA changes. The folding times for each region of the RNA were measured by plotting the fraction of RNA cleaved versus time. The time for RNase H digestion (10 sec) was added to each point. The data were fit to a single exponential. Folding of P7 and P4/6 were faster than the first time point (17 sec). Note that P1 and P2 become less accessible to the respective oligonucleotide probes at 10 min. This reproducible effect presumably reflects that P1 and P2 become stabilized in the native complex. (C) Accessibility of P1 and P2 using extended RNase H digestion. The data show that a significant fraction of RNA is cleaved at early (10–40 sec) times after protein addition when the pre-RNA was probed using a 1-min RNase H incubation time. (D) Iodine cleavage of GαS substituted A.n. COB RNA as a function of time. End-labeled RNA was incubated with I-AniI for 10–300 sec and then cleaved with iodine for 10 sec and the reaction quench with β-mercaptoethanol. The products were separated by denaturing gel electrophoresis. The regions of A.n. COB pre-RNA cleaved by iodine shown to the side of the gel image. All of the changes upon addition of I-AniI happened before the first time point (20 sec), and therefore were assigned a rate of >50 min−1. A similar rate of overall folding was also observed with RNase 1 and V1 (data not shown).
FIGURE 6.
FIGURE 6.
Model for A.n. COB pre-RNA/I-AniI assembly. Although important for binding, the P3–P7 domain is not shown for simplicity. Dashed lines indicate single-stranded or destabilized double-stranded regions and the cylinders represent helices. Prior to binding, the P4 and P6 helices in the core are unstable and, as a consequence, P1 and P2 are not properly positioned in the core. In the first step of binding, I-AniI associates with the intron RNA in a weak complex and promotes folding of the catalytic core. Within this complex, P1 and P2 become destabilized and subsequently dock into its intron's catalytic site that leads to the first step in splicing. The P1/P2 docked structure is inferred, since I-AniI binding results in splicing activation (see Discussion). This docking event may cause subtle rearrangements in the I-AniI binding site in P4, resulting in tighter binding and formation of the native complex. The relative orientation of the helices in the free RNA and intermediate complexes is not intended to reflect a specific conformation. I-AniI may dissociate from the RNA in the encounter complexes because of their short half-lives, but once in the native complex, binding is essentially irreversible (Solem et al. 2002).

Similar articles

Cited by

References

    1. Adams, P.L., Stahley, M.R., Gill, M.L., Kosek, A.B., Wang, J., Strobel, S.A. Crystal structure of a group I intron splicing intermediate. RNA. 2004;10:1867–1887. - PMC - PubMed
    1. Allain, F.H., Gubser, C.C., Howe, P.W., Nagai, K., Neuhaus, D., Varani, G. Specificity of ribonucleoprotein interaction determined by RNA folding during complex formulation. Nature. 1996;380:646–650. - PubMed
    1. Avis, J.M., Allain, F.H., Howe, P.W., Varani, G., Nagai, K., Neuhaus, D. Solution structure of the N-terminal RNP domain of U1A protein: The role of C-terminal residues in structure stability and RNA binding. J. Mol. Biol. 1996;257:398–411. - PubMed
    1. Bartley, L.E., Zhuang, X., Das, R., Chu, S., Herschlag, D. Exploration of the transition state for tertiary structure formation between an RNA helix and a large structured RNA. J. Mol. Biol. 2003;328:1011–1026. - PubMed
    1. Batey, R.T., Williamson, J.R. Effects of polyvalent cations on the folding of an rRNA three-way junction and binding of ribosomal protein S15. RNA. 1998;4:984–997. - PMC - PubMed

Publication types

LinkOut - more resources