. 2006 Dec 15;78(24):8200-6.
doi: 10.1021/ac0608772.

Gas-phase chiral separations by ion mobility spectrometry

Affiliations

Gas-phase chiral separations by ion mobility spectrometry

Prabha Dwivedi et al. Anal Chem. .

Abstract

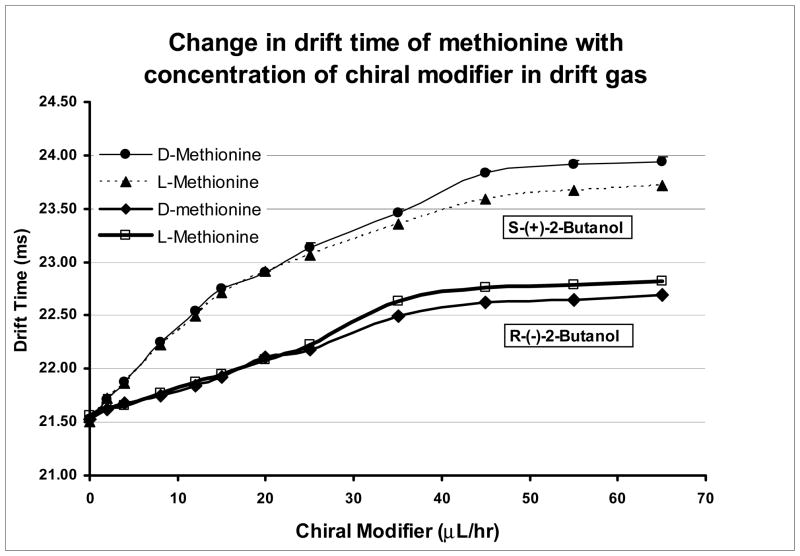
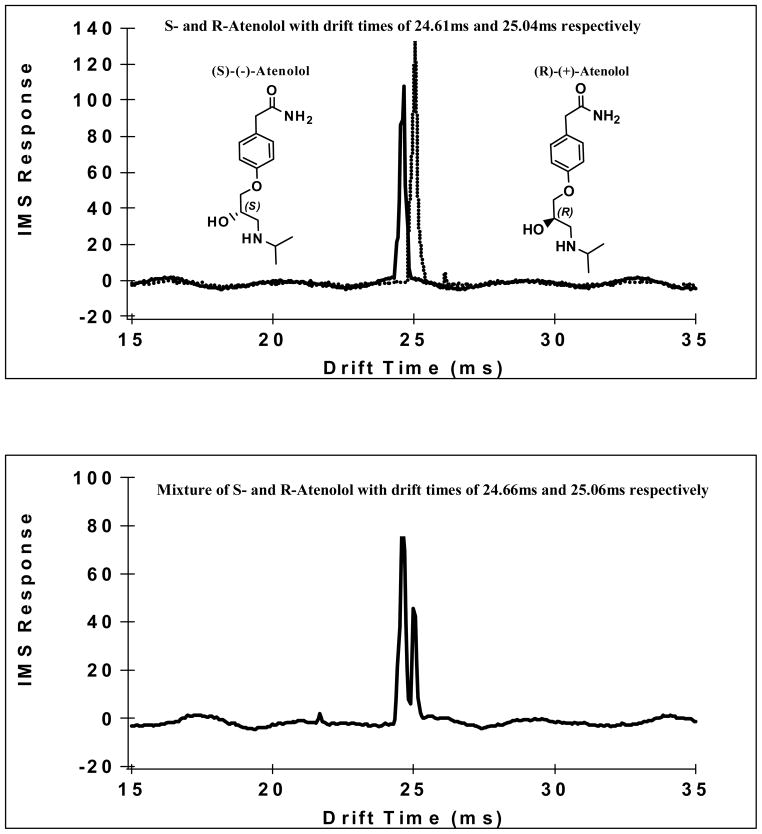
This article introduces the concept of chiral ion mobility spectrometry (CIMS) and presents examples demonstrating the gas-phase separation of enantiomers of a wide range of racemates including pharmaceuticals, amino acids, and carbohydrates. CIMS is similar to traditional ion mobility spectrometry, where gas-phase ions, when subjected to a potential gradient, are separated at atmospheric pressure due to differences in their shapes and sizes. In addition to size and shape, CIMS separates ions based on their stereospecific interaction with a chiral gas. In order to achieve chiral discrimination by CIMS, an asymmetric environment was provided by doping the drift gas with a volatile chiral reagent. In this study (S)-(+)-2-butanol was used as a chiral modifier to demonstrate enantiomeric separations of atenolol, serine, methionine, threonine, methyl alpha-glucopyranoside, glucose, penicillamine, valinol, phenylalanine, and tryptophan from their respective racemic mixtures.


Figures

Figure 1
Figure 1. A schematic illustrating the 3-point-rule “Pirkle Rule” required for chiral recognition
CIMS separation utilizes stereo-chemically different non-covalent interactions between the enantiomers (1 and 2) and the chiral modifier (3).
Figure 2
Figure 2. Photograph and schematic diagram of the electrospray ionization-atmospheric pressure ion mobility-mass spectrometer
The IMS cell was divided into a desolvation region (7.5 cm) and a drift region (25 cm) by a Bradbury-Nielsen ion gate which was used to pulse ion packets into the drift region with a pulse width of 0.1 milliseconds. The Q-MS was operated in single ion monitoring mode to monitor the arrival time distributions of mass selected ions.
Figure 3
Figure 3. Superimposed Ion Mobility Spectra of racemic mixtures in nitrogen drift gas
The figure shows that racemic mixtures of enantiomers drifted with same mobility in pure nitrogen as drift gas. Mixtures represented in the spectra above are those of valinol, threonine, penicillamine, tryptophan, methyl-α-D-glucopyranoside and atenolol. Each enantiomer was present in the electrospray solution at a mixing ration of 100 ppm. Samples were introduced into IMS from the electrospray at a rate of 3 μL/min. Experiments were repeated three separate times and the average standard deviation of the drift time measurement was 0.04 ms.
Figure 4
Figure 4. Effect of chirality and flow rate of the modifier on the arrival times of the methionine enantiomers
The figure shows retardation in mobility of methionine enantiomers with increasing concentration of either S-(+)-2-butanol or R-(−)-2-butanol as the chiral modifiers in nitrogen drift gas. Better separation of enantiomers was observed with S-(+)-2-butanol as the chiral modifier (separation factor of 1.01) as compared to R-(−)-2-butanol (separation factor of 1.006). The order of elution of methionine enantiomers was reversed for the two modifiers. Optimal flow rate of the chiral modifier was ~45 μL/hr which corresponded to about 10ppm of chiral modifier in the nitrogen drift gas. Each experiment was repeated three times and the standard deviation of the arrival times varied by ~2%. These error bars are too small to be seen in the Figure.
Figure 5
Figure 5. Gas phase separation of atenolol enantiomers
The upper graph shows the superimposed spectrum of S- and R-atenolol obtained after introduction 10 ppm of S-(+)-2-butanol as the chiral modifier in the inert nitrogen drift gas. The bottom graph demonstrates the separation of the enantiomers from their racemic mixture. An average standard deviation of 0.05 ms in drift times was measured from three separate ion mobility measurements.
Figure 6
Figure 6. Ion mobility spectra illustrating the gas phase separation of tryptophan enantiomers
The upper graph shows the superimposed spectrum of L- and D- tryptophan obtained after introduction of 10 ppm of S-(+)-2-butanol as the chiral modifier in the inert nitrogen drift gas. The bottom graph demonstrates the separation of the enantiomers from their racemic mixture. Experiments were repeated three separate times and the average standard deviation of the drift time measurement was 0.05 ms.
Figure 7
Figure 7. Ion mobility spectra illustrating the gas phase separation of sodium adduct of D- and L-Methyl-α-glucopyranoside enantiomers
The upper graph shows the superimposed spectrum of D- and L-Methyl-α-glucopyranoside enantiomers obtained after introduction of 10 ppm of S-(+)-2-butanol as the chiral modifier in the inert nitrogen drift gas. The bottom graph demonstrates the separation of the enantiomers from their racemic mixture. An average standard deviation of 0.07 ms in drift time was measured from triplicate ion mobility-measurements.

References

    1. Hutt AJ. Smith and Williams’ Introduction to the Principles of Drug Design and Action. 4. 2006. pp. 117–183.
    1. Federsel HJ. Chirality. 2003;15(Suppl):S128–142. - PubMed
    1. Kreil G. Annual Review of Biochemistry. 1997;66:337–345. - PubMed
    1. Shapira R, Wilkinson KD, Shapira G. Progress in clinical and biological research. 1989;292:487–496. - PubMed
    1. Buczek O, Yoshikami D, Bulaj G, Jimenez EC, Olivera BM. J Biol Chem. 2005;280:4247–4253. - PubMed

Publication types

MeSH terms