Comparative Study
. 2006 Nov 24;2(11):e203.
doi: 10.1371/journal.pgen.0020203. Epub 2006 Oct 18.

Impact of nonsense-mediated mRNA decay on the global expression profile of budding yeast

Affiliations
Comparative Study

Impact of nonsense-mediated mRNA decay on the global expression profile of budding yeast

Qiaoning Guan et al. PLoS Genet. .

Abstract

Nonsense-mediated mRNA decay (NMD) is a eukaryotic mechanism of RNA surveillance that selectively eliminates aberrant transcripts coding for potentially deleterious proteins. NMD also functions in the normal repertoire of gene expression. In Saccharomyces cerevisiae, hundreds of endogenous RNA Polymerase II transcripts achieve steady-state levels that depend on NMD. For some, the decay rate is directly influenced by NMD (direct targets). For others, abundance is NMD-sensitive but without any effect on the decay rate (indirect targets). To distinguish between direct and indirect targets, total RNA from wild-type (Nmd(+)) and mutant (Nmd(-)) strains was probed with high-density arrays across a 1-h time window following transcription inhibition. Statistical models were developed to describe the kinetics of RNA decay. 45% +/- 5% of RNAs targeted by NMD were predicted to be direct targets with altered decay rates in Nmd(-) strains. Parallel experiments using conventional methods were conducted to empirically test predictions from the global experiment. The results show that the global assay reliably distinguished direct versus indirect targets. Different types of targets were investigated, including transcripts containing adjacent, disabled open reading frames, upstream open reading frames, and those prone to out-of-frame initiation of translation. Known targeting mechanisms fail to account for all of the direct targets of NMD, suggesting that additional targeting mechanisms remain to be elucidated. 30% of the protein-coding targets of NMD fell into two broadly defined functional themes: those affecting chromosome structure and behavior and those affecting cell surface dynamics. Overall, the results provide a preview for how expression profiles in multi-cellular eukaryotes might be impacted by NMD. Furthermore, the methods for analyzing decay rates on a global scale offer a blueprint for new ways to study mRNA decay pathways in any organism where cultured cell lines are available.


Conflict of interest statement

Competing interests. The authors have declared that no competing interests exist.

Figures
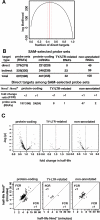
Figure 1
Figure 1. Classification of the NMD-Sensitive RNAs
(A) Maximum likelihood estimate of the proportion of direct targets of NMD. (B) 607 probe sets identified by SAM as NMD targets that increase in abundance in the Nmd strain fell into three groups: protein-coding mRNAs, RNAs related to transposable TY elements and solo LTRs, and non-annotated RNAs corresponding to genomic sequences identified by SAGE tags. In each column the number of probe sets is shown. The number of protein-coding RNAs is shown in parentheses. Some RNAs are represented by more than one probe set. Direct targets have NMD-sensitive decay rates and indirect targets have NMD-insensitive decay rates. For each of the three groups, the predicted direct targets sub-divide into those with an FCR <1 or >1, determined by dividing the predicted fold change in half-life in the Nmd strain by the fold change in half-life in the Nmd+ strain. (C) The top panels show the relationship between FCR and the p-value. The bottom panels show the half-lives of predicted direct targets in the Nmd+ strain plotted against the half-lives in the Nmd strain.
Figure 2
Figure 2. FCR for mRNA Half-Lives
Representative protein-coding transcripts where FCR was <1 in a global decay rate experiment were re-analyzed in conventional half-life experiments. (A, D, G, J, and M) illustrate the relative kinetics of mRNA decay from array data (n = 3) using a curve-fitting algorithm (see Text S1) (red solid lines, Nmd+; black solid lines, Nmd; dashed lines, 90% confidence intervals). (B, E, H, K, and N) show conventional half-life experiments using a standard time course. (C, F, I, and L) show conventional half-life experiments using clustered early time points. For each mRNA, decay curves are arranged vertically. RNA levels were monitored by Northern blotting after inhibition of transcription with thiolutin. The FCR and standard error are shown for each mRNA. In this and subsequent figures, the FCR values correspond to the initial phase of decay when biphasic decay curves were observed. The results are summarized in Table 1.
Figure 3
Figure 3. False Discoveries and Misclassifications
FDRs and misclassifications were empirically tested by conventional half-life experiments. Representative RNA decay data for four false discoveries and two misclassifications (n = 3) are presented in the same format as described in Figure 2. The results are summarized in Table 1.
Figure 4
Figure 4. Confirmation of Global Predictions
Representative RNA decay data for five transcripts are shown (n = 3) where global predictions were borne out by conventional half-life experiments. The format is identical to Figure 2. The results are summarized in Table 1.
Figure 5
Figure 5. Degradation of Natural RNA Targets by NMD
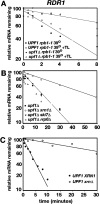
(A) Thiolutin has no effect on mRNA decay. RDR1 mRNA decay was examined using two methods to inhibit transcription: addition of thiolutin and exposure of cells carrying rpb1–1 (impaired RNAP II) to a restrictive growth temperature of 39 °C [70]. Transcription was inhibited in UPF1 and upf1Δ cells by temperature-shift alone or by temperature-shift combined with the addition of thiolutin. A representative experiment (n = 3) is shown where RNA levels were determined by Northern blotting. (B) A representative experiment (n = 3) is shown where the kinetics of RDR1 mRNA decay were monitored after addition of thiolutin in upf1Δ cells carrying mutations that block decay from the 5′ end (xrn1Δ) or the 3′ end (ski7Δ or rrp6Δ). (C) A representative experiment (n = 3) is shown where the kinetics of RDR1 mRNA decay was monitored after addition of thiolutin in UPF1 cells carrying XRN1 or xrn1Δ.
Figure 6
Figure 6. Targeting of dORFs
(A) Relative kinetics of decay from array data for two NMD-sensitive dORFs. (B) Organization of the dORFs. The stop codons were changed to rare (low CAI) and commonly used (high CAI) sense codons [77]. (C) Effects of the mutations on RNA abundance expressed as the FCR (n = 3). (D) Comparison of half-lives of yil164-UGG and yil168W-AGA RNA. FCRs were calculated for n = 3.
Figure 7
Figure 7. Targeting through uORFs
(A) Two uORF start codons are present in the FZF1 sequence. The uORF stop codon is located upstream of the start codon of the coding ORF in the −1 reading frame. The position of a sequence resembling a downstream element reported to be required for NMD [78,79] is shown. uORF start codons were changed to AGG sense codons. DSE, downstream element. (B) Steady-state RNA levels for FZF1, fzf1-Δ1, fzf1-Δ2, and fzf1-Δ1,-Δ2 determined by Northern blotting. (C) Comparison of FZF1 and fzf1-Δ1,-Δ2 RNA half-lives in Nmd+ and Nmd strains. Half-lives, FCRs, and p-values were calculated for n = 5. (D) Potential uORFs with end points between −100 and +100 nucleotides of predicted direct targets as a function of start position and total length. Left: upper and lower numbers refer to uORFs that end downstream and upstream of the coding ORF start codon, respectively.
Figure 8
Figure 8. Targeting through Out-of-Frame Initiation of Translation
(A) AUGCAI(r) scores were calculated to evaluate the influence of context on the efficiency of translation initiation. The bit score indicates relative sequence conservation at a given nucleotide position and the height of nucleotide symbols indicates the frequency of nucleotide use. Standard numbering (parentheses) differs from Web logo numbering. The bar chart shows the distribution of AUGCAI(r) scores for protein-coding transcripts that satisfy criteria for targeting by leaky scanning. The dot plot shows the distribution of candidate transcripts where the AUGCAI(r) score of the initiator AUG is plotted against the score for the downstream out-of-frame AUG. Red dots correspond to transcripts considered to be likely candidates for leaky scanning based solely on the presence of U or C at the −3 position. (B) Sequence changes in RDR1 DNA and comparison of RDR1 and rdr1-AUG transcript half-lives in Nmd+ and Nmd strains. (C) Sequence changes in ASF2 DNA and comparison of ASF2 and asf2-AUG transcript half-lives in Nmd+ and Nmd strains.
Figure 9
Figure 9. Networks of NMD-Sensitive Transcripts
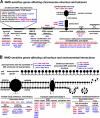
(A) Summary of NMD-sensitive genes coding for proteins that affect chromosome structure and behavior, including telomere replication and maintenance, chromatin silencing, replication, recombination, repair, components of the spindle apparatus such as the kinetochore and spindle pole body, and chromosome transmission. Among these, 32 probe sets detected RNAs expressed at higher levels due to de-silencing of repeated genes in six multi-gene families whose members are located in the sub-telomeric repeats near chromosome ends. (B) Summary of NMD-sensitive genes coding for proteins that affect the cell surface and environmental interactions, including surface receptors for signal transduction, macromolecular transport, synthesis breakdown of the plasma membrane, cell wall mannoproteins, and the MDR system for cellular defense against toxins. Transcripts that increase in abundance in Nmd strains are indicated in red for direct targets with altered decay rates and blue for indirect targets with unaltered decay rates. Targets that decrease in abundance in Nmd strains are indicated in green.

Similar articles

Cited by

References

    1. Culbertson MR, Leeds P. Looking at mRNA decay pathways through the window of molecular evolution. Curr Op Gen Dev. 2003;13:207–214. - PubMed
    1. Lynch M, Richardson AO. The evolution of spliceosomal introns. Curr Op Gen Dev. 2002;12:701–710. - PubMed
    1. Culbertson M. RNA surveillance: Unforeseen consequences for gene expression, inherited genetic disorders, and cancer. Trends Genet. 1999;15:74–80. - PubMed
    1. He F, Jacobson A. Identification of a novel component of the nonsense-mediated mRNA decay pathway by use of an interacting protein screen. Genes Dev. 1995;9:437–454. - PubMed
    1. Lee BS, Culbertson MR. Identification of an additional gene required for eukaryotic nonsense mRNA turnover. Proc Natl Acad Sci U S A. 1995;92:10354–10358. - PMC - PubMed

Publication types

MeSH terms