

Genomic selective constraints in murid noncoding DNA
- PMID: 17166057
- PMCID: PMC1657059
- DOI: 10.1371/journal.pgen.0020204
Genomic selective constraints in murid noncoding DNA
Abstract
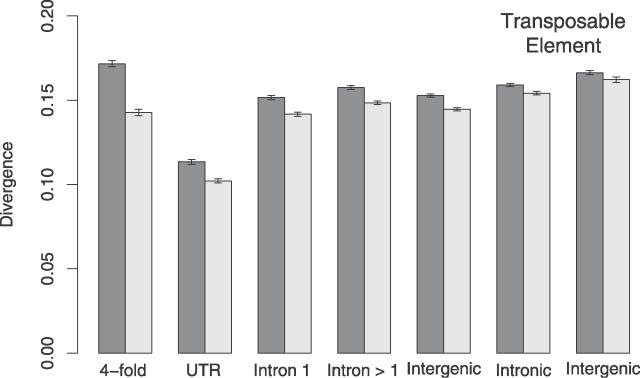
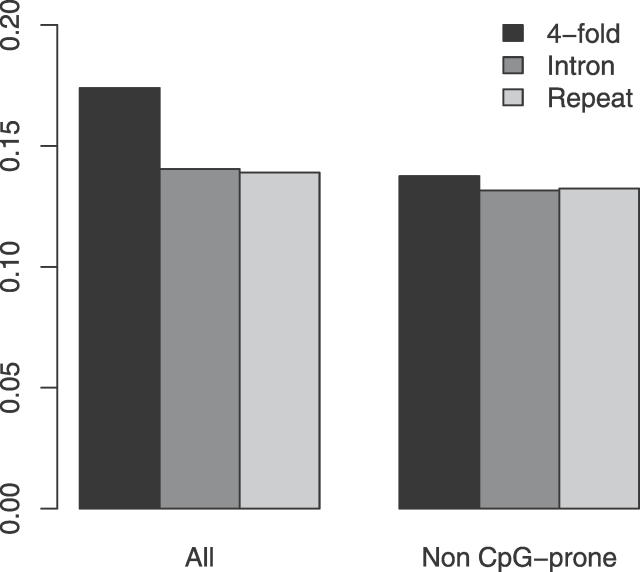
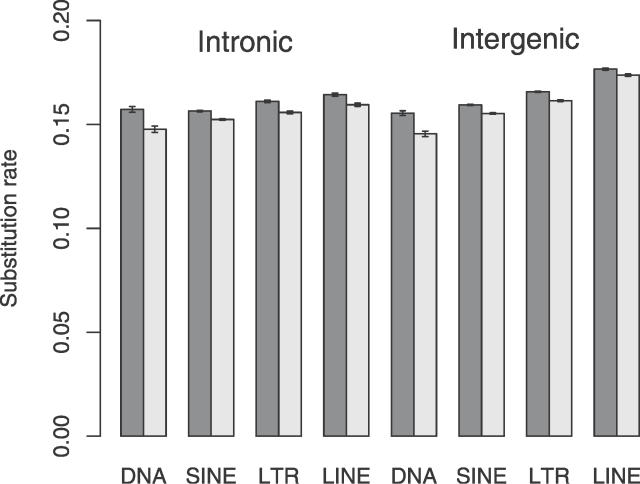
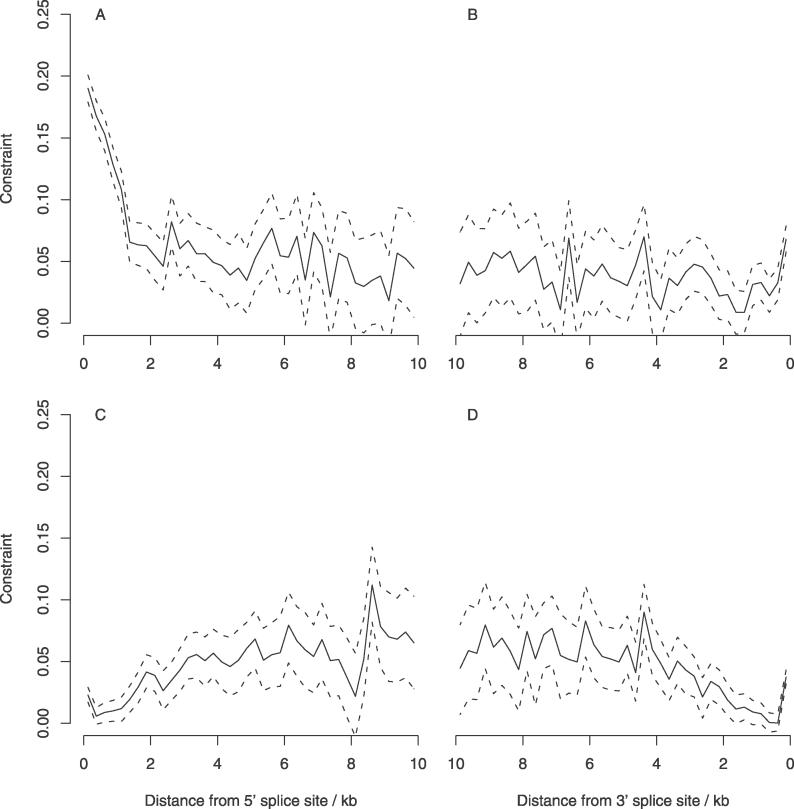
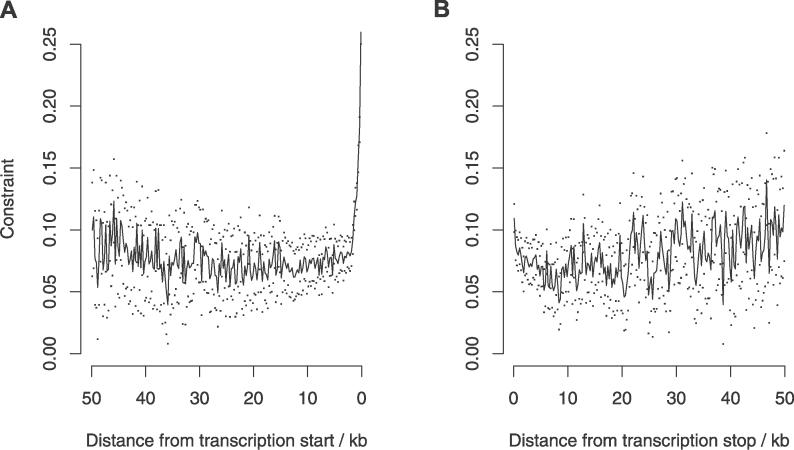
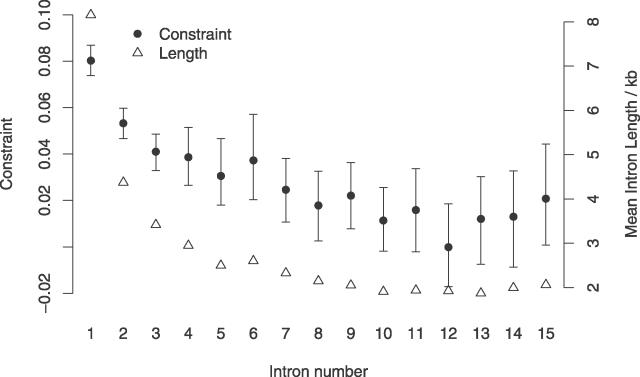
Recent work has suggested that there are many more selectively constrained, functional noncoding than coding sites in mammalian genomes. However, little is known about how selective constraint varies amongst different classes of noncoding DNA. We estimated the magnitude of selective constraint on a large dataset of mouse-rat gene orthologs and their surrounding noncoding DNA. Our analysis indicates that there are more than three times as many selectively constrained, nonrepetitive sites within noncoding DNA as in coding DNA in murids. The majority of these constrained noncoding sites appear to be located within intergenic regions, at distances greater than 5 kilobases from known genes. Our study also shows that in murids, intron length and mean intronic selective constraint are negatively correlated with intron ordinal number. Our results therefore suggest that functional intronic sites tend to accumulate toward the 5' end of murid genes. Our analysis also reveals that mean number of selectively constrained noncoding sites varies substantially with the function of the adjacent gene. We find that, among others, developmental and neuronal genes are associated with the greatest numbers of putatively functional noncoding sites compared with genes involved in electron transport and a variety of metabolic processes. Combining our estimates of the total number of constrained coding and noncoding bases we calculate that over twice as many deleterious mutations have occurred in intergenic regions as in known genic sequence and that the total genomic deleterious point mutation rate is 0.91 per diploid genome, per generation. This estimated rate is over twice as large as a previous estimate in murids.
Conflict of interest statement
Competing interests. The authors have declared that no competing interests exist.
Figures
Similar articles
-
Distributions of selectively constrained sites and deleterious mutation rates in the hominid and murid genomes.Mol Biol Evol. 2010 Jan;27(1):177-92. doi: 10.1093/molbev/msp219. Mol Biol Evol. 2010. PMID: 19759235
-
Functional constraints and frequency of deleterious mutations in noncoding DNA of rodents.Proc Natl Acad Sci U S A. 2003 Nov 11;100(23):13402-6. doi: 10.1073/pnas.2233252100. Epub 2003 Nov 3. Proc Natl Acad Sci U S A. 2003. PMID: 14597721 Free PMC article.
-
Patterns of evolutionary constraints in intronic and intergenic DNA of Drosophila.Genome Res. 2004 Feb;14(2):273-9. doi: 10.1101/gr.1329204. Genome Res. 2004. PMID: 14762063 Free PMC article.
-
Why so many noncoding nucleotides? The eukaryote genome as an epigenetic machine.Genetica. 2002 May;115(1):105-29. doi: 10.1023/a:1016080316076. Genetica. 2002. PMID: 12188043 Review.
-
Functions of noncoding sequences in mammalian genomes.Biochemistry (Mosc). 2014 Dec;79(13):1442-69. doi: 10.1134/S0006297914130021. Biochemistry (Mosc). 2014. PMID: 25749159 Review.
Cited by
-
Selective constraints in experimentally defined primate regulatory regions.PLoS Genet. 2008 Aug 15;4(8):e1000157. doi: 10.1371/journal.pgen.1000157. PLoS Genet. 2008. PMID: 18704158 Free PMC article.
-
A selection index for gene expression evolution and its application to the divergence between humans and chimpanzees.PLoS One. 2012;7(4):e34935. doi: 10.1371/journal.pone.0034935. Epub 2012 Apr 18. PLoS One. 2012. PMID: 22529958 Free PMC article.
-
Insights Into the Molecular Evolution of AT-Hook Motif Nuclear Localization Genes in Brassica napus.Front Plant Sci. 2021 Sep 9;12:714305. doi: 10.3389/fpls.2021.714305. eCollection 2021. Front Plant Sci. 2021. PMID: 34567028 Free PMC article.
-
Effect of the assignment of ancestral CpG state on the estimation of nucleotide substitution rates in mammals.BMC Evol Biol. 2008 Sep 30;8:265. doi: 10.1186/1471-2148-8-265. BMC Evol Biol. 2008. PMID: 18826599 Free PMC article.
-
In plants, expression breadth and expression level distinctly and non-linearly correlate with gene structure.Biol Direct. 2009 Nov 21;4:45; discussion 45. doi: 10.1186/1745-6150-4-45. Biol Direct. 2009. PMID: 19930585 Free PMC article.
References
-
- Lander ES, Linton LM, Birren B, Nusbaum C, Zody MC, et al. Initial sequencing and analysis of the human genome. Nature. 2001;409:860–921. - PubMed
-
- Waterston RH, Lindblad-Toh K, Birney E, Rogers J, Abril JF, et al. Initial sequencing and comparative analysis of the mouse genome. Nature. 2002;420:520–562. - PubMed
-
- Gibbs RA, Weinstock GM, Metzker ML, Muzny DM, Sodergren EJ, et al. Genome sequence of the brown Norway rat yields insights into mammalian evolution. Nature. 2004;428:493–521. - PubMed
-
- Mikkelsen TS, Hillier LW, Eichler EE, Zody MC, Jaffe DB, et al. Initial sequence of the chimpanzee genome and comparison with the human genome. Nature. 2005;437:69–87. - PubMed
-
- Dermitzakis ET, Reymond A, Lyle R, Scamuffa N, Ucla C, et al. Numerous potentially functional but non-genic conserved sequences on human Chromosome 21. Nature. 2002;420:578–582. - PubMed
MeSH terms
Substances
LinkOut - more resources
Full Text Sources
