

Sensitivity of 70-mer oligonucleotides and cDNAs for microarray analysis of gene expression in Arabidopsis and its related species
- PMID: 17166142
- PMCID: PMC2034503
- DOI: 10.1046/j.1467-7652.2003.00048.x
Sensitivity of 70-mer oligonucleotides and cDNAs for microarray analysis of gene expression in Arabidopsis and its related species
Abstract
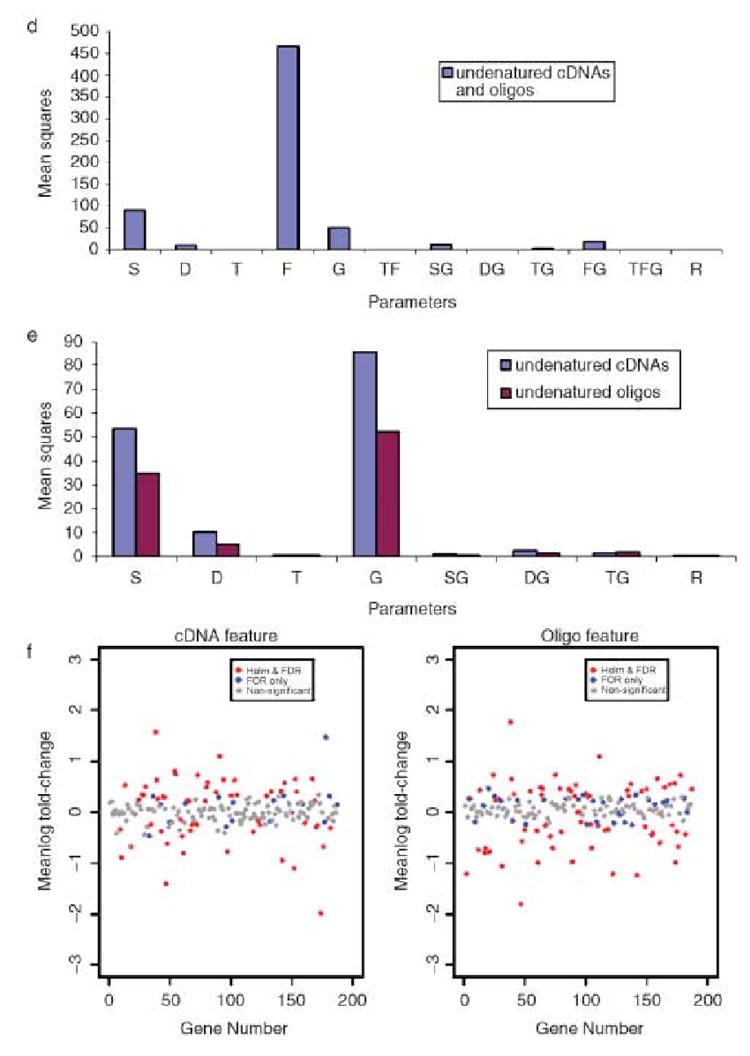
Synthetic oligonucleotides (oligos) represent an attractive alternative to cDNA amplicons for spotted microarray analysis in a number of model organisms, including Arabidopsis, C. elegans, Drosophila, human, mouse and yeast. However, little is known about the relative effectiveness of 60-70-mer oligos and cDNAs for detecting gene expression changes. Using 192 pairs of Arabidopsis thaliana cDNAs and corresponding 70-mer oligos, we performed three sets of dye-swap experiments and used analysis of variance (anova) to compare sources of variation and sensitivities for detecting gene expression changes in A. thaliana, A. arenosa and Brassica oleracea. Our major findings were: (1) variation among different RNA preparations from the same tissue was small, but large variation among dye-labellings and slides indicates the need to replicate these factors; (2) sources of variation were similar for experiments with all three species, suggesting these feature types are effective for analysing gene expression in related species; (3) oligo and cDNA features had similar sensitivities for detecting expression changes and they identified a common subset of significant genes, but results from quantitative RT-PCR did not support the use of one over the other. These findings indicate that spotted oligos are at least as effective as cDNAs for microarray analyses of gene expression. We are using oligos designed from approximately 26,000 annotated genes of A. thaliana to study gene expression changes in Arabidopsis and Brassica polyploids.
Figures


References
-
- Arabidopsis Genome Initiative. Analysis of the genome sequence of the flowering plant Arabidopsis thaliana. Nature. 2000;408:796–815. - PubMed
-
- Bachem CW, van der Hoeven RS, de Bruijn SM, Vreugdenhil D, Zabeau M, Visser RG. Visualization of differential gene expression using a novel method of RNA fingerprinting based on AFLP: analysis of gene expression during potato tuber development. Plant J. 1996;9:745–753. - PubMed
-
- Benjamini Y, Hochberg Y. Controlling the false discovery rate: a practical and powerful approach to multiple testing. J Royal Stat Soci (Series B) 1995;57:289–300.
-
- Black MA. PhD Thesis. West Lafayette, Indiana: Department of Statistics, Purdue University; 2002. Statistical issues in the design and analysis of spotted microarray experiments.
-
- Black MA, Doerge RW. Calculation of the minimum number of replicate spots required for detection of significant gene expression fold change in microarray experiment. Bioinformatics. 2002;18:1609–1616. - PubMed
Grants and funding
LinkOut - more resources
Full Text Sources
Miscellaneous
