. 2006 Oct-Dec;19(4):853-70.
doi: 10.1177/039463200601900415.

Processing sites are different in the generation of HLA-A2.1-restricted, T cell reactive tumor antigen epitopes and viral epitopes

Affiliations

Processing sites are different in the generation of HLA-A2.1-restricted, T cell reactive tumor antigen epitopes and viral epitopes

X F Yang et al. Int J Immunopathol Pharmacol. 2006 Oct-Dec.

Abstract

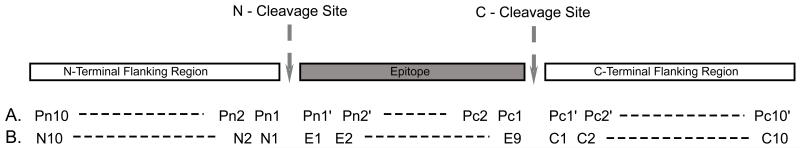
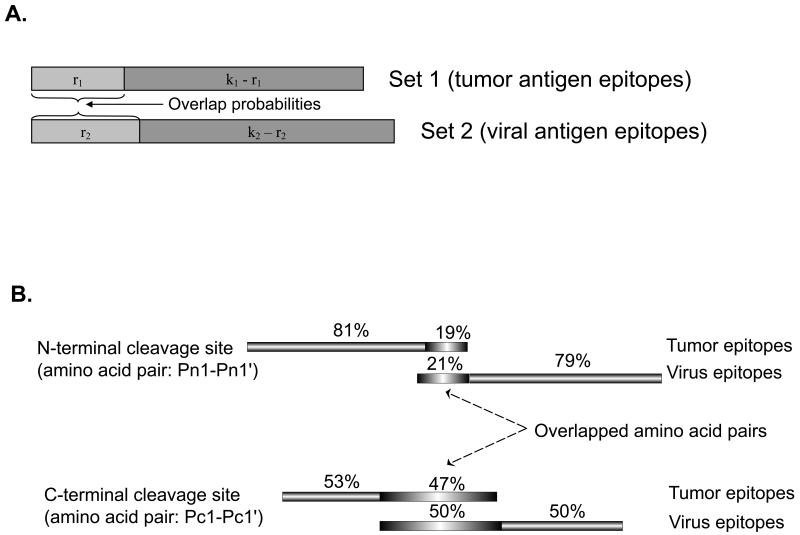
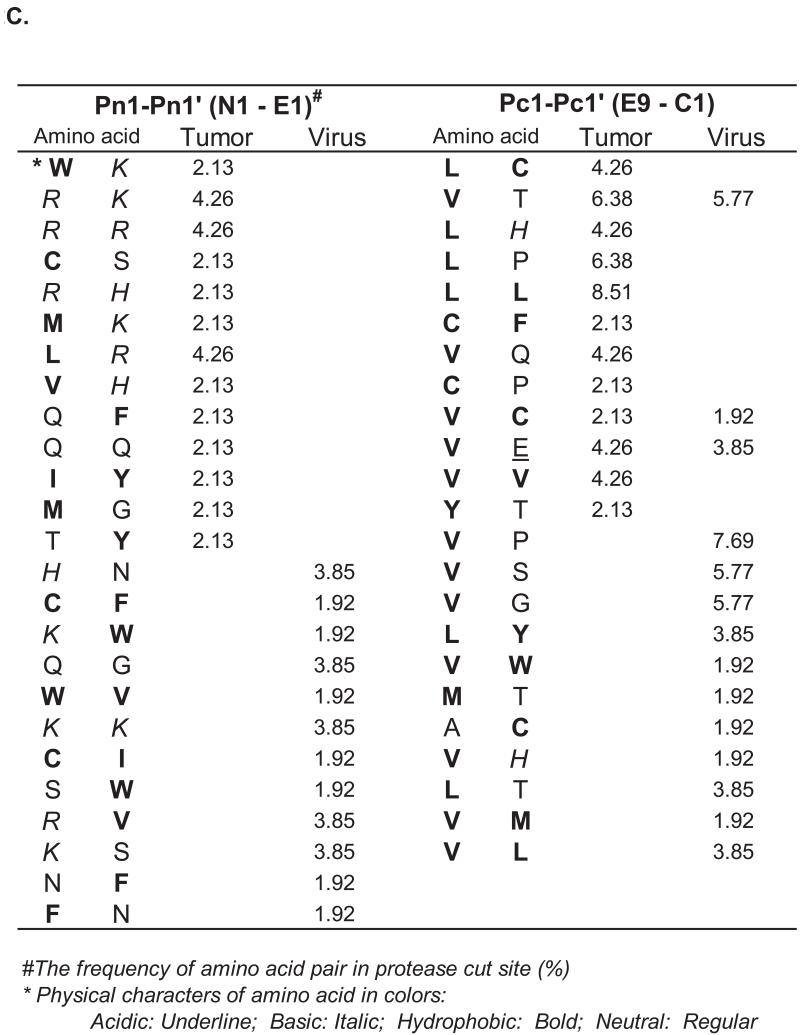
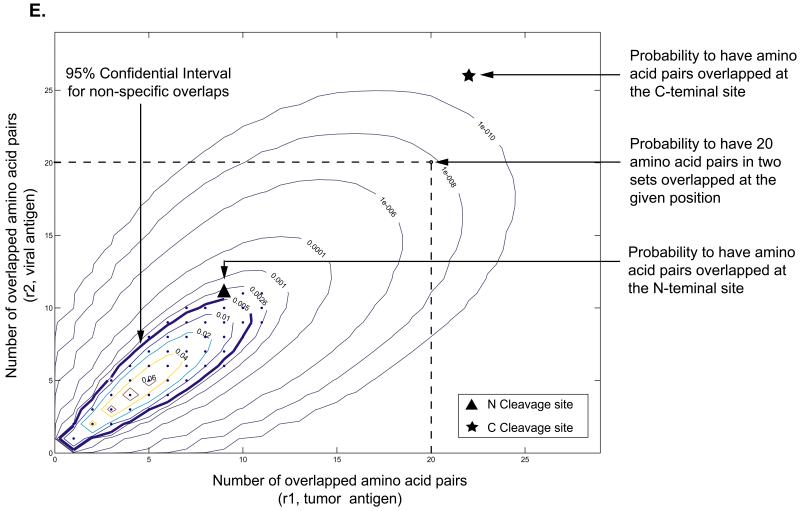
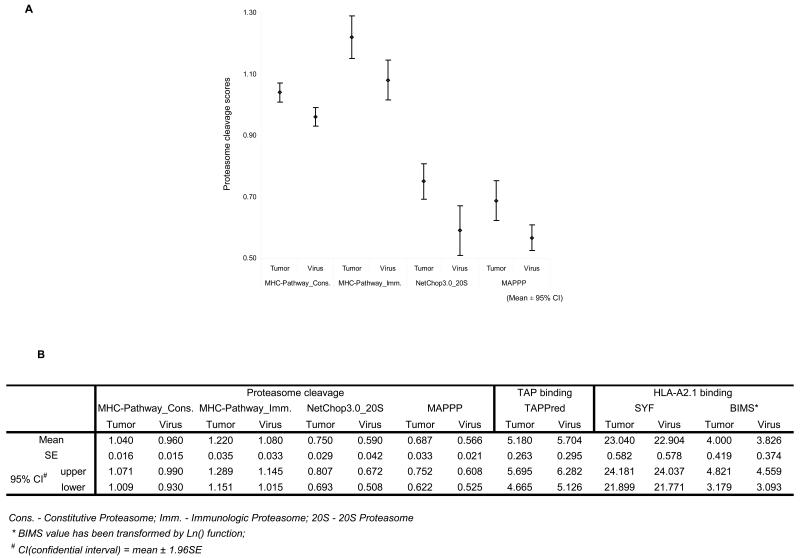
In order to improve the processing efficiency of T cell tumor antigen epitopes, this bioinformatic study compares proteolytic sites in the generation of 47 experimentally identified HLA-A2.1-restricted immunodominant tumor antigen epitopes to those of 52 documented HLA-A2.1-restricted immunodominant viral antigen epitopes. Our results show that the amino acid frequencies in the C-terminal cleavage sites of the tumor antigen epitopes, as well as several positions within the 10 amino acid (aa) flanking regions, are significantly different from those of the viral antigen epitopes. In the 9 amino acid epitope region, frequencies differed somewhat in the secondary-anchored amino acid residues on E3 (the third aa of the epitope), E4, E6, E7 and E8; however, frequencies in the primary-anchored positions, on E2 and E9, for binding in the HLA-A2.1 groove, remained almost identical. The most frequently occurring amino acid pairs in both N-terminal and C-terminal cleavage sites in the generation of tumor antigen epitopes were different from those of the viral antigen epitopes. Our findings demonstrate for the first time that these two groups of epitopes may be cleaved by distinct sets of proteasomes and peptidases or similar enzymes with lower efficiencies for tumor epitopes. In the future, in order to more effectively generate tumor antigen epitopes, targeted activation of the immunoproteasomes and peptidases that mediate the cleavage of viral epitopes could be achieved, thus enhancing our potential for antigen-specific tumor immunotherapy.


Figures

Fig. 1
Fig. 1. Position nomenclature of the epitopes and the flanking regions
A. Schechter and Berger’s enzymatic cleavage nomenclature is used in reference to the amino acid positions in the N-terminal and C-terminal flanking regions, relative to their respective cleavage sites. B. Two cleavage sites are required during the final step of antigen epitope generation. Since there is an overlap between the C-terminal flanking region of the epitope’s N-terminal cleavage site and the N-terminal flanking region of the epitope’s C-terminal cleavage site, in order to avoid potential confusion, the amino acids in the epitope (E1 to E9), the N-terminal flanking region (N10-N1), and the C-terminal flanking region (C1-C10) are uniquely defined.
Fig. 2
Fig. 2. Comparison of the amino acid pairs located in the N-terminal cleavage sites (Pn1-Pn1′) and the C-terminal cleavage sites (Pc1-Pc1′) in the tumor antigen and viral antigen epitopes
A. Schematic representation of the notation for the two overlapping sets of amino acid pairs. For the computation of probability mass function, the overlapped amino acid pairs in set 1 (tumor epitopes) are assigned as r1, the corresponding remainders (nonoverlapping) in the same set are assigned as k1-r1. Similarly, the overlapped amino acid pairs (nonoverlapping) in set 2 (viral epitopes) are assigned as r2, the corresponding remainders in the same set are assigned as k2-r2. B. Schematic representation of the percentages of identical amino acid pairs versus the different amino acid pairs in the tumor antigen and viral antigen epitopes. Since identical amino acid pairs can be present more than once, percentages for the two groups are slightly different. Note that there are twenty amino acids; thus, theoretically, there are 400 possible amino acid pairs. C. The frequently occurring amino acid pairs (i.e., those occurring more than once) located in the N-terminal cleavage sites (Pn1-Pn1′) and the C-terminal cleavage sites (Pc1-Pc1′) in the tumor antigen and viral antigen epitopes. Percentages of the amino acid pairs in the tumor epitope or the viral epitope group are presented as frequencies. The physical characteristics of the amino acids are indicated through the use of different font formats: acidic, underline; basic, italic; hydrophobic, bold; and neutral, grey. D. The surface plot of probability mass function. The ordinate indicates the number of overlapped amino acid pairs (r2) in the viral epitopes, the abscissa indicates the number of overlapped amino acid pairs (r1) in the tumor epitopes, and the Z-axis indicates the probability mass function. The probability mass function demonstrates the distribution of the probability for any given overlaps of amino acid pairs in the N-terminal cleavage sites and C-terminal sites in two sets. The curve line indicates the probability for the 95% of all the random overlaps of amino acid pairs (95% confidential interval). E. The contour plot of probability mass function. The events sharing the probability are linked by a contour curve. The ordinate indicates the number of overlapped amino acid pairs (r1) in the tumor epitopes, and the abscissa indicates the number of overlapped amino acid pairs (r2) in the viral epitopes. A loop with the probability of 0.005 indicates the probability for the 95% of all the random overlaps of amino acid pairs (95% confidential interval), which corresponds to the curve line presented in Fig. 2D. The probabilities to have the amino acid pairs overlapped at the N-terminal sites and C-terminal sites in two sets of epitopes (Fig. 2B) are marked in the plot by a triangle and a star, respectively.
Fig. 3
Fig. 3. Comparison of proteasome cleavage scores, and the binding potential of TAP and HLA-A2.1 in the tumor versus viral epitopes
A. Schematic representation of the differences in predicted proteasome cleavage scores of the tumor and viral epitopes. Prediction of proteasome cleavage scores of the epitope-containing antigen sequences was performed by using the algorithms MHC-pathway constitutive proteasomes, MHC-Pathway immunoproteasome, NetChop3.0, and MAPPP. The mean ± 1.96 SE of the proteasome cleavage scores of the antigen sequences was calculated for a 95% confidence interval (95% CI). The resulting lack of overlap in the 95% CI indicates that there is a difference in proteasome cleavage scores for the tumor versus viral epitopes. B. Statistical comparison of proteasome cleavage scores, TAP binding potential, and HLA-A2.1 binding potential of the tumor versus viral epitopes, predicted through commonly used algorithms. The BIMS value of antigen epitopes was transformed by Ln function before the statistical analyses.

Similar articles

Cited by

References

    1. Finn OJ. Cancer vaccines: Between the idea and the reality. Nat. Rev. Immunol. 2003;3:630. - PubMed
    1. Yang F, Yang XF. New concepts in tumor antigens: Their significance in future immunotherapies for tumors. Cell Mol. Immunol. 2005;2:331. - PubMed
    1. Lollini PL, Cavallo F, Nanni P, Forni G. Vaccines for tumour prevention. Nat. Rev. Cancer. 2006;6:204. - PubMed
    1. De Visser KE, Schumacher TN, Kruisbeek AM. Cd8+ t cell tolerance and cancer immunotherapy. J. Immunother. 2003;26:1. - PubMed
    1. Van Der Bruggen P, Van Den Eynde BJ. Processing and presentation of tumor antigens and vaccination strategies. Curr. Opin. Immunol. 2006;18:98. - PubMed

Publication types