. 2007 Feb 9;366(1):307-15.
doi: 10.1016/j.jmb.2006.11.017. Epub 2006 Nov 10.

Modeling the evolution of protein domain architectures using maximum parsimony

Affiliations

Modeling the evolution of protein domain architectures using maximum parsimony

Jessica H Fong et al. J Mol Biol. .

Abstract

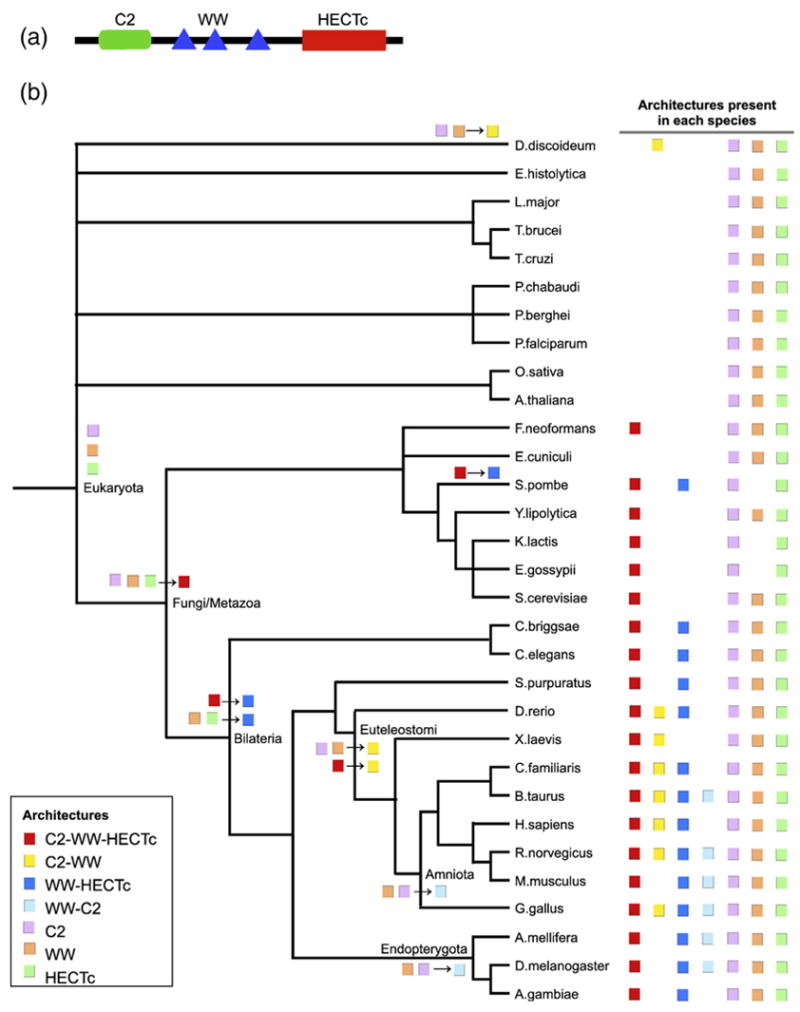
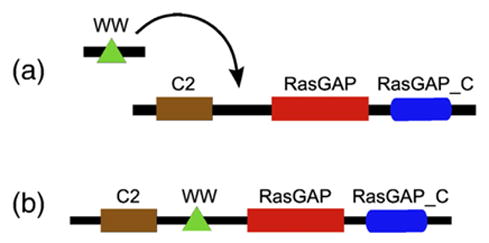
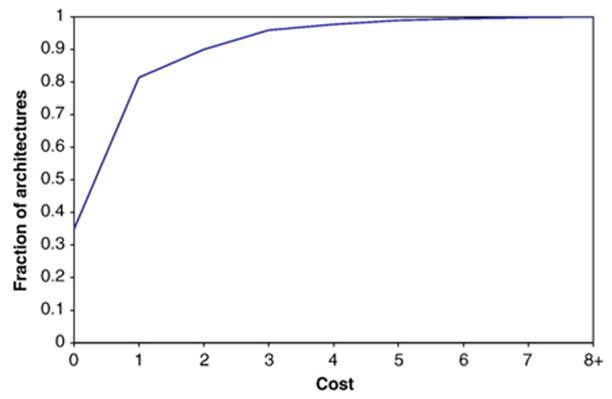
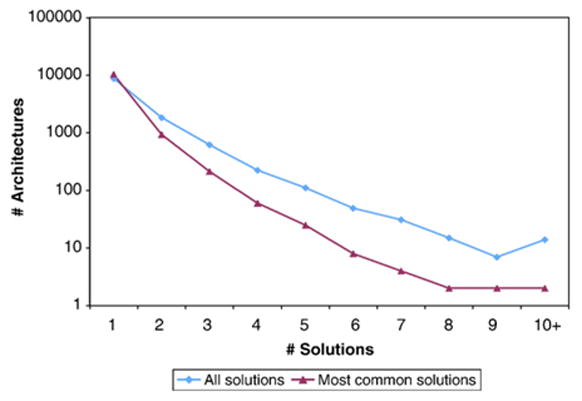
Domains are basic evolutionary units of proteins and most proteins have more than one domain. Advances in domain modeling and collection are making it possible to annotate a large fraction of known protein sequences by a linear ordering of their domains, yielding their architecture. Protein domain architectures link evolutionarily related proteins and underscore their shared functions. Here, we attempt to better understand this association by identifying the evolutionary pathways by which extant architectures may have evolved. We propose a model of evolution in which architectures arise through rearrangements of inferred precursor architectures and acquisition of new domains. These pathways are ranked using a parsimony principle, whereby scenarios requiring the fewest number of independent recombination events, namely fission and fusion operations, are assumed to be more likely. Using a data set of domain architectures present in 159 proteomes that represent all three major branches of the tree of life allows us to estimate the history of over 85% of all architectures in the sequence database. We find that the distribution of rearrangement classes is robust with respect to alternative parsimony rules for inferring the presence of precursor architectures in ancestral species. Analyzing the most parsimonious pathways, we find 87% of architectures to gain complexity over time through simple changes, among which fusion events account for 5.6 times as many architectures as fission. Our results may be used to compute domain architecture similarities, for example, based on the number of historical recombination events separating them. Domain architecture "neighbors" identified in this way may lead to new insights about the evolution of protein function.


Figures

Figure 1
Figure 1
C2-WW-HECTc architecture. (a) Schematic architecture diagram from CDART. (b) Rearrangement tree for architectures containing the C2, WW, or HECTc domains and no other domains. Architectures shown here include C2-WW-HECTc (red), C2-WW (yellow), WW-HECTc (blue), WW-C2 (light blue), C2 (purple), WW (orange), and HECTc (green). The presence of each architecture in each species is indicated at the right. Each line of boxes on the tree corresponds to a potential rearrangement event that produces a new architecture at the closest labeled node. C2, WW, and HECTc single-domain architectures appear in Eukaryota as rearrangement class New Domain. C2-WW-HECTc appears at the Fungi/Metazoa node as a fusion of three architectures. The emergence of WW-HECTc and C2-WW can be attributed to the fission of C2-WW-HECTc or fusion of the respective one-domain architectures; the potential solutions differ for each of their new occurrences. The C2 and WW domains also appear in the other order, as WW-C2 architecture, which comes about through the respective fusions.
Figure 2
Figure 2
(a) Insertion rearrangement of WW into architecture CH-RasGAP-RasGAP_C takes place at the Amniota ancient species to produce (b) CH-WW-RasGAP-RasGAP_C. WW is present in most Eukaryotes, CH-RasGAP-RasGAP_C in many Fungi/Metazoa, and CH-WW-RasGAP-RasGAP_C in exactly four of the six Amniota species in our data set.
Figure 3
Figure 3
Fraction of architectures with cost at most i.
Figure 4
Figure 4
Number of architectures for every number of solutions, including all solutions (blue) and only the most-common solutions (pink).
Figure 5
Figure 5
Number of source architectures plotted against the number of target architectures, using a version of a log-log graph in which the y-axis uses a logarithmic scale while the x-axis represents values grouped into bins. Bin i includes 2i targets starting with i=0 and 0 targets.

References

    1. Bork P. Mobile modules and motifs. Curr Opin Struct Biol. 1992;2:413–421.
    1. Marchler-Bauer A, Panchenko AR, Shoemaker BA, Thiessen PA, Geer LY, Bryant SH. CDD: a database of conserved domain alignments with links to domain three-dimensional structure. Nucl Acids Res. 2002;30:281–283. - PMC - PubMed
    1. Marchler-Bauer A, Anderson JB, Cherukuri PF, DeWeese-Scott C, Geer LY, Gwadz M, et al. CDD: a conserved domain database for protein classification. Nucl Acids Res. 2005;33:D192–D196. - PMC - PubMed
    1. Murzin AG, Brenner SE, Hubbard T, Chothia C. SCOP: a structural classification of proteins database for the investigation of sequences and structures. J Mol Biol. 1995;247:536–540. - PubMed
    1. Bateman A, Birney E, Cerruti L, Durbin R, Etwiller L, Eddy SR, et al. The Pfam protein families database. Nucl Acids Res. 2002;30:276–280. - PMC - PubMed

Publication types

LinkOut - more resources