

Clinical assessment of two new contrast sensitivity charts
- PMID: 17166891
- PMCID: PMC1955579
- DOI: 10.1136/bjo.2006.109280
Clinical assessment of two new contrast sensitivity charts
Abstract
Background: Contrast sensitivity measurement in UK clinical practice is most commonly performed with the Pelli-Robson chart.
Aims: To compare the repeatability of two new contrast sensitivity charts and to measure their agreement with the Pelli-Robson charts.
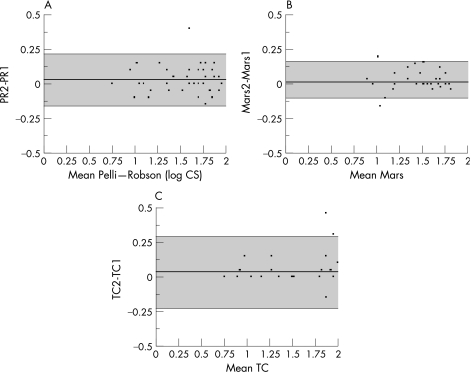
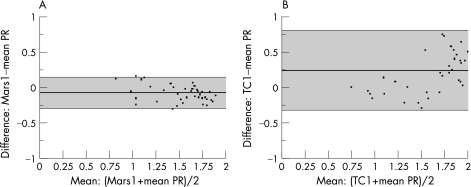
Method: Contrast sensitivity was measured monocularly using two versions of the Mars letter contrast sensitivity chart, two presentations on the Test Chart 2000 and two versions of the Pelli-Robson chart. Bland-Altman techniques were used to assess repeatability and agreement.
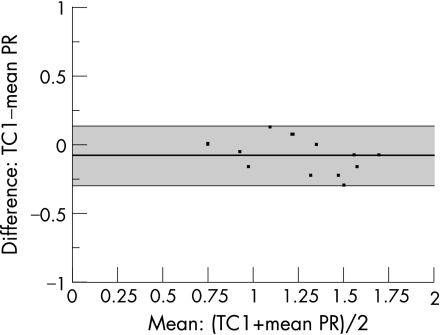
Results: 53 subjects were recruited with visual acuity from 6/4 to 6/72. The coefficient of repeatability was 0.182 for the Pelli-Robson chart, 0.121 for the Mars chart and 0.238 for Test Chart 2000. Limits of agreement with the Pelli-Robson chart were -0.29 to +0.15 log units for the Mars letter contrast sensitivity chart and -0.32 to +0.78 log units for the Test Chart 2000. For patients with poor contrast sensitivity, the limits of agreement between the Test Chart 2000 and the Pelli-Robson chart improved from -0.33 to +0.15 log units.
Conclusion: In a population of hospital ophthalmology patients, the coefficient of repeatability is better for the Mars chart and worse for the Test Chart 2000 when compared with the Pelli-Robson chart. The electronic test chart does not agree well with the Pelli-Robson chart, although this might simply be due to the performance of liquid crystal display screens at low contrast levels. The Mars letter contrast sensitivity chart shows good validity and reasonable agreement with the Pelli-Robson chart.
Conflict of interest statement
Competing interests: None declared.
References
-
- Wood J M. How do visual status and age impact on driving performance as measured on a closed circuit driving track? Ophthal Physiol Opt 19991934 - PubMed
-
- Wood J M. Age and visual impairment decrease driving performance as measured on a closed‐road circuit. Hum Factors 200244482–494. - PubMed
-
- Whittaker S G, Lovie‐Kitchen J. Visual requirements for reading. Optom Vis Sci 19937054–65. - PubMed
-
- Rubin G S, Legge G E. Psychophysics of reading. VI—The role of contrast in low vision. Vision Res 19892979–91. - PubMed
-
- Leat S J, Woo G C. The validity of current clinical tests of contrast sensitivity and their ability to predict reading speed in low vision. Eye 199711893–899. - PubMed
Publication types
MeSH terms
LinkOut - more resources
Full Text Sources
Miscellaneous