. 2007 Mar;81(5):2429-39.
doi: 10.1128/JVI.01969-06. Epub 2006 Dec 13.

A multicomponent RNA-based control system regulates subgenomic mRNA transcription in a tombusvirus

Affiliations

A multicomponent RNA-based control system regulates subgenomic mRNA transcription in a tombusvirus

Han-Xin Lin et al. J Virol. 2007 Mar.

Abstract

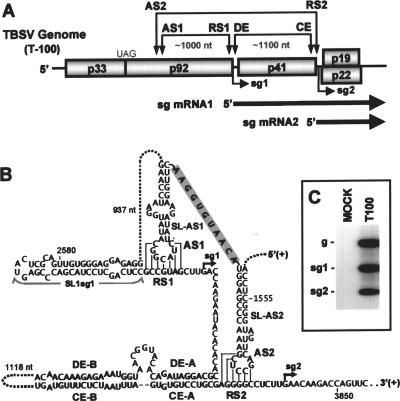
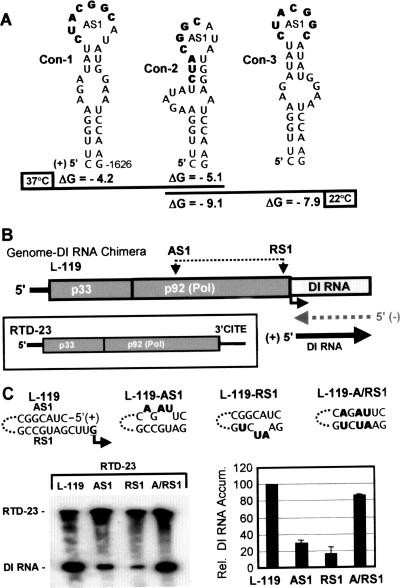
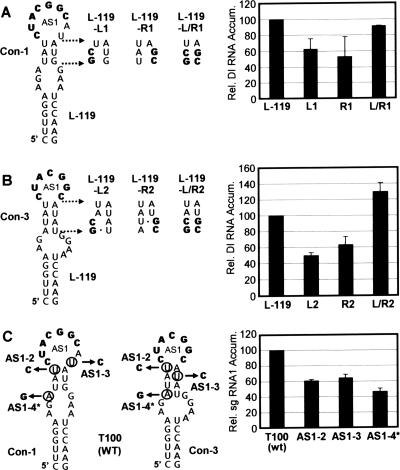
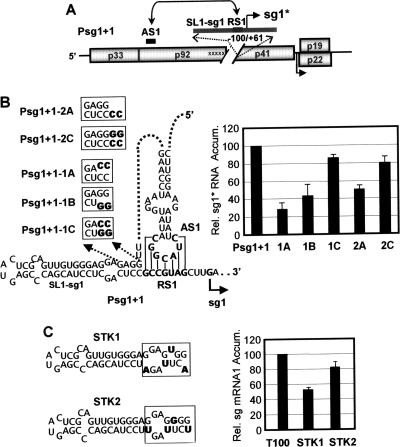
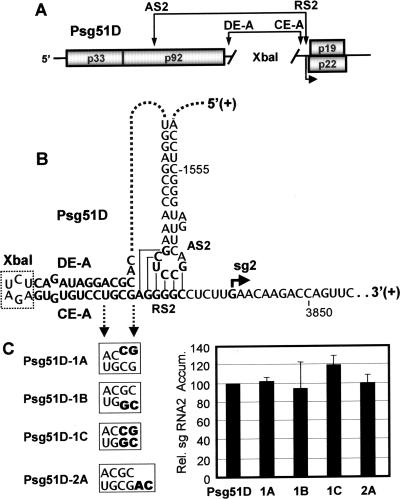
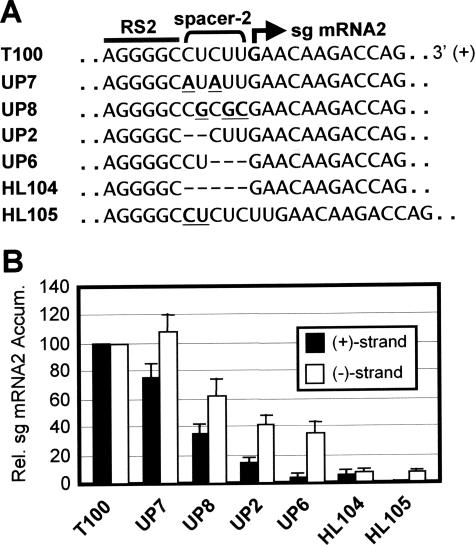
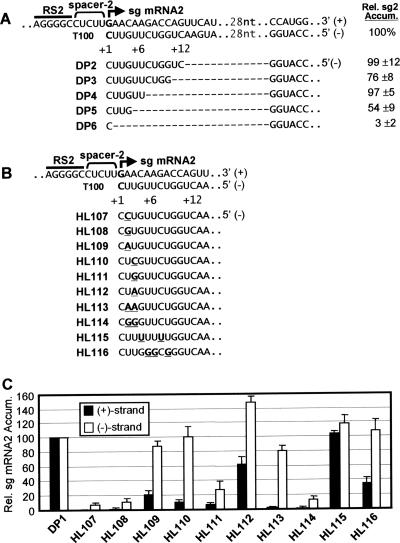
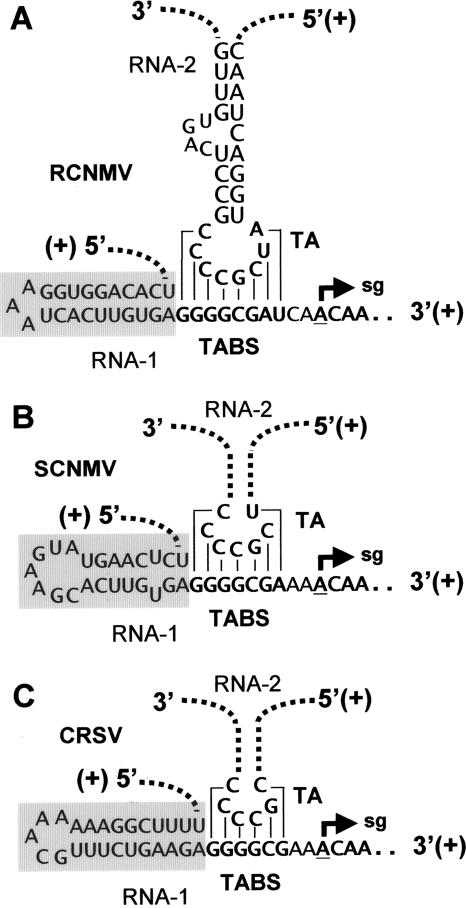
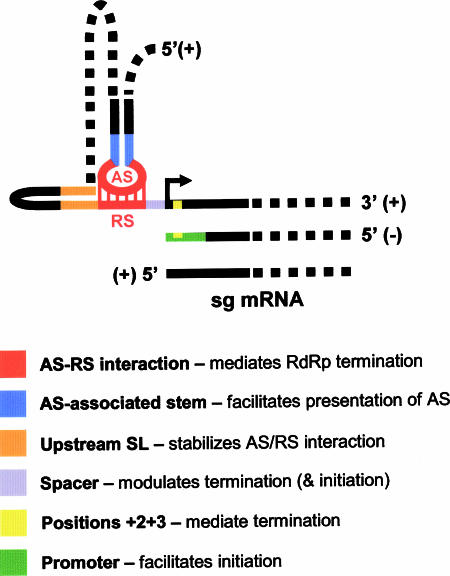
During infections, positive-strand RNA tombusviruses transcribe two subgenomic (sg) mRNAs that allow for the expression of a subset of their genes. This process is thought to involve an unconventional mechanism involving the premature termination of the virally encoded RNA-dependent RNA polymerase while it is copying the virus genome. The 3' truncated minus strands generated by termination are then used as templates for sg mRNA transcription. In addition to requiring an extensive network of long-distance RNA-RNA interactions (H.-X. Lin and K. A. White, EMBO J. 23:3365-3374, 2004), the transcription of tombusvirus sg mRNAs also involves several additional RNA structures. In vivo analysis of these diverse RNA elements revealed that they function at distinct steps in the process by facilitating the formation or stabilization of the long-distance interactions, modulating minus-strand template production, or promoting the initiation of sg mRNA transcription. All of the RNA elements characterized could be readily incorporated into a premature termination model for sg mRNA transcription. Overall, the analyses revealed a complex system that displays a high level of structural integration and functional coordination. This multicomponent RNA-based control system may serve as a useful paradigm for understanding related transcriptional processes in other positive-sense RNA viruses.


Figures

FIG. 1.
FIG. 1.
The wt TBSV genome (T100) and long-distance RNA-RNA interactions that mediate sg mRNA transcription. (A) Linear representation of the TBSV RNA genome showing its coding organization. The relative positions of interacting RNA elements involved in sg mRNA transcription are shown above the genome and are indicated by double-headed arrows. Initiation sites for sg mRNA transcription are labeled sg1 and sg2, and corresponding structures of the two sg mRNAs are represented by bold arrows below the genome. (B) The long-distance RNA-RNA interactions that regulate sg mRNA transcription in TBSV are shown in detail. Relevant sequences of the TBSV genome are presented with corresponding genomic coordinates. The AS1/RS1 base-pairing interaction is essential for the efficient transcription of sg mRNA1 (3), while the AS2/RS2 and DE-A/CE-A base-pairing interactions facilitate sg mRNA2 transcription (2, 13, 47). The proposed stem-loop structures, which encompass the AS1 and AS2 elements, are separated by an 11-nt-long sequence (shaded gray). A putative structure, SL1-sg1, located immediately 5′ to RS1 is also shown. Initiation sites for the two sg mRNAs are indicated by small arrows. (C) Northern blot analysis of TBSV viral RNAs. A representative example of viral RNA accumulation in TBSV-infected cucumber protoplasts after a 22-h incubation at 22°C. The positions of the TBSV genome (g) and its two subgenomic mRNAs (sg1 and sg2) are indicated to the left. TBSV- and mock-infected lanes are labeled T100 and MOCK, respectively. Viral RNAs were detected by Northern blotting using a 32P-labeled oligonucleotide probe complementary to the 3′ terminal sequence of the TBSV genome.
FIG. 2.
FIG. 2.
Analysis of the AS1/RS1 interaction in a genome-DI RNA chimera. (A) Alternative SL-AS1 structures. The AS1 elements are presented in bold within three different possible conformations (con-1 through con-3) predicted using different mfold parameters (3). (B) Schematic representation of the genome-DI RNA chimera. The AS1 and RS1 elements in the genome-DI RNA chimera and the proposed “launching” scheme for the production of DI RNA are shown above and below the chimera, respectively. In the boxed inset, the general structure of RTD-23, used as a source of p33 and p92 in cotransfections, is depicted. The functional 3′CITE at the 3′ end of RTD-23 is labeled. (C) Functional analysis of mutant genome-DI chimeras. The substitutions (in bold) in the AS1 and RS1 elements in the genome-DI RNA chimeras are shown at the top. Northern blot analysis was carried out with viral RNAs isolated from protoplasts cotransfected with RTD-23 and the different genome-DI RNA chimeras. The positions of DI RNA and RTD-23 in the blot are indicated, and the RNAs present in each infection are indicated above each lane. The corresponding relative (Rel.) levels of accumulation (Accum.) of the DI RNAs were determined from radioanalytical scanning of blots and are presented graphically on the right. The values represent means with standard deviations (error bars) from three independent experiments.
FIG. 3.
FIG. 3.
Analysis of SL-AS1 in the genome-DI RNA chimera and TBSV genome. (A) Compensatory mutational analysis of the upper stem in con-1. Mutations introduced into the genome-DI RNA chimera are indicated to the right of the structure with substitutions in bold. Relative levels of DI RNA accumulation are presented graphically on the right. (B) Compensatory mutational analysis of the upper stem in con-3 using the genome-DI RNA chimera. Relative levels of DI RNA accumulation are presented graphically on the right. For panels A and B, the relative DI RNA accumulation levels were calculated as described in the legend for Fig. 2. (C) Analysis of SL-AS1 in the wt TBSV genome (T100). Mutations introduced into the genome at degenerate positions are mapped onto both con-1 and con-3. The nucleotides circled were substituted with those indicated by the arrows. Note that AS1-4* has all three of the substitutions shown. Mutant genomes were transfected into protoplasts, and viral RNAs were analyzed by Northern blotting following a 22-h incubation. The corresponding relative (Rel.) levels of accumulation (Accum.) of sg mRNA1 were determined from radioanalytical scanning of blots. The relative sg mRNA1 accumulation levels correspond to means with standard deviations (error bars) from three independent experiments and represent the ratios of sg mRNA1 levels to their corresponding genomic RNA levels, all normalized to that for T100.
FIG. 4.
FIG. 4.
Analysis of SL-AS2 in the TBSV genome. (A) Compensatory mutations introduced into the genome (T100) at degenerate positions are indicated to the right of the structure. (B) Relative (Rel.) levels of sg mRNA1 are presented graphically. Analysis and quantification of sg mRNA1 levels were carried out as described in the legend for Fig. 3. Error bars indicate standard deviations. Accum., accumulation.
FIG. 5.
FIG. 5.
Analysis of SL1-sg1 in Psg1+1 and the TBSV genome. (A) Schematic representation of the Psg1+1 mutant genome (47). Each substitution at a degenerate position in the p92 coding region is indicated by an “x,” and the gap represents the region deleted downstream of this ORF. At the top, the inserted segment containing wt versions of SL1-sg1, RS1, and associated downstream sequences is shown. The functional AS1/RS1 interaction in this mutant genome is represented by the double-headed arrow connecting these elements, and the initiation site for sg1* is indicated by the solid arrow. (B) Mutations (in bold) that were introduced into SL1-sg1 in Psg1+1 are indicated in the boxes, and corresponding sg1* levels are shown to the right. (C) Substitutions (in bold) introduced into the wt genome (T100) at degenerate positions are indicated in the boxes, and corresponding sg mRNA1 levels are shown to the right. Analysis and quantification were carried out as described in the legend for Fig. 3. Error bars indicate standard deviations. Rel., relative; Accum., accumulation.
FIG. 6.
FIG. 6.
Analysis of a localized DE-A/CE-A interaction in Psg51D. (A) Schematic representation of the Psg51D mutant TBSV genome (2). The AS2/RS2 and DE-A/CE-A interactions are indicted by double-headed arrows. The ∼1,100-nt-long sequence between DE-A and CE-A was deleted (indicated by the space between diagonal lines) and replaced by sequence corresponding to an XbaI restriction enzyme site. (B) RNA sequence and secondary structure of relevant portions of Psg51D. The XbaI restriction enzyme site is enclosed by a dotted box. (C) Mutations (in bold) introduced into DE-A and/or CE-A in Psg51D are indicated in the boxes, and relative sg mRNA2 levels are shown to the right. Analysis and quantification were carried out as described in the legend for Fig. 3. Error bars indicate standard deviations. Rel., relative; Accum., accumulation.
FIG. 7.
FIG. 7.
Analysis of the spacer 2 element in the TBSV genome. (A) Mutations introduced into the spacer 2 element (delineated by the bracket) that is located between RS2 (bar) and the site of initiation (bold arrow). Substitutions and an insertion are in bold and underlined, while deleted nucleotides are represented by dashes. (B) Relative accumulation levels of plus (+) and minus (−) strands of sg mRNA2 are presented graphically. Analysis and quantification were carried out as described in the legend for Fig. 3. Error bars indicate standard deviations. Rel., relative; Accum., accumulation.
FIG. 8.
FIG. 8.
Analysis of the promoter 2 element in the TBSV genome. (A) Internal deletion analysis of the promoter region for sg mRNA2. At the top, the complementary plus and minus strands that correspond to this region in the wt genome (T100) are shown. The RS2 element (bar), the spacer 2 element (bracket), and the site of sg mRNA2 initiation (bold arrow) are denoted. The numbering system used specifies nucleotides in the minus strand. Position +1 corresponds to the minus-strand nucleotide that templates initiation (i.e., C), and the increasing numbers correspond to adjacent minus-strand positions going in the 5′ direction. Other sequence that is not shown due to space constraints is represented by dots with the number of missing nucleotides indicated. Deletions (represented by dashes) that were introduced are shown in the minus strands below. Relative sg mRNA2 levels are indicated to the right. (B) Substitution analysis of the promoter region for sg mRNA2. Nucleotides that were substituted are in bold and underlined. (C) Relative accumulation levels of the plus (+) and minus (−) strands of sg mRNA2 are presented. DP1 is a TBSV genome in which the p19 and p22 ORFs were inactivated by the introduction of stop codons (allowing for the analysis of transcriptional activity independent of possible effects due to the perturbation of the sg mRNAs translational function). DP1 was used to construct the accompanying promoter mutants. Analysis and quantification were carried out as described in the legend for Fig. 3.
FIG. 9.
FIG. 9.
Predicted SL structures located immediately 5′ to the TABS elements in Dianthovirus genomes. The structures correspond to (A) RCNMV, (B) Sweet clover necrotic mosaic virus (SCNMV), and (C) Carnation ringspot virus (CRSV). The TA/TABS interaction for RCNMV occurs between genomic segments RNA1 and RNA2, and similar intermolecular interactions are proposed to occur in SCNMV and CRSV (33). The TA SL for SCNMV and CRSV are not shown and are instead depicted by dotted lines. The proposed SL structures located 5′ to the TABS elements (that are positioned similarly to SL1-sg1 relative to the RS1 element in TBSV) are indicated by gray boxes.
FIG. 10.
FIG. 10.
A refined PT model for sg mRNA transcription in TBSV. The model presented (not to scale) is generic and incorporates RNA elements involved in sg mRNA1 and/or sg mRNA2 transcription. A list of proposed functions for the color-coded RNA elements in the schema is provided. See the text for details.

Similar articles

Cited by

References

    1. Buck, K. W. 1996. Comparison of the replication of positive-stranded RNA viruses of plants and animals. Adv. Virus Res. 47:159-251. - PMC - PubMed
    1. Choi, I. R., M. Ostrovsky, G. Zhang, and K. A. White. 2001. Regulatory activity of distal and core RNA elements in tombusvirus subgenomic mRNA2 transcription. J. Biol. Chem. 276:41761-41768. - PubMed
    1. Choi, I. R., and K. A. White. 2002. An RNA activator of subgenomic mRNA1 transcription in tomato bushy stunt virus. J. Biol. Chem. 277:3760-3766. - PubMed
    1. Fabian, M. R., H. Na, D. Ray, and K. A. White. 2003. 3′-terminal RNA secondary structures are important for accumulation of tomato bushy stunt virus DI RNAs. Virology 313:567-580. - PubMed
    1. Fabian, M. R., and K. A. White. 2004. 5′-3′ RNA-RNA interaction facilitates cap- and poly(A) tail-independent translation of tomato bushy stunt virus mRNA: a potential common mechanism for Tombusviridae. J. Biol. Chem. 279:28862-28872. - PubMed

Publication types

LinkOut - more resources