. 2006 Dec 13;26(50):12861-72.
doi: 10.1523/JNEUROSCI.4507-05.2006.

The linear computational algorithm of cerebellar Purkinje cells

Affiliations

The linear computational algorithm of cerebellar Purkinje cells

Joy T Walter et al. J Neurosci. .

Abstract

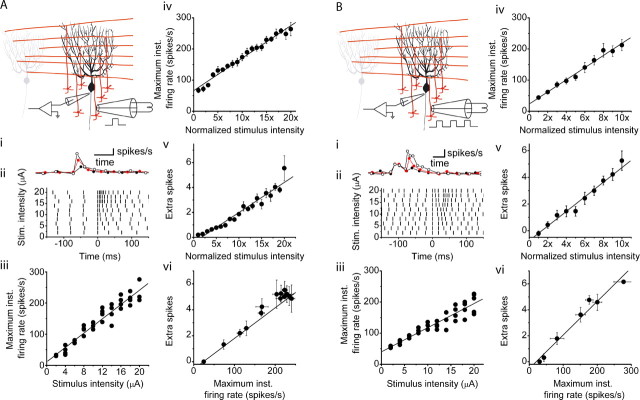
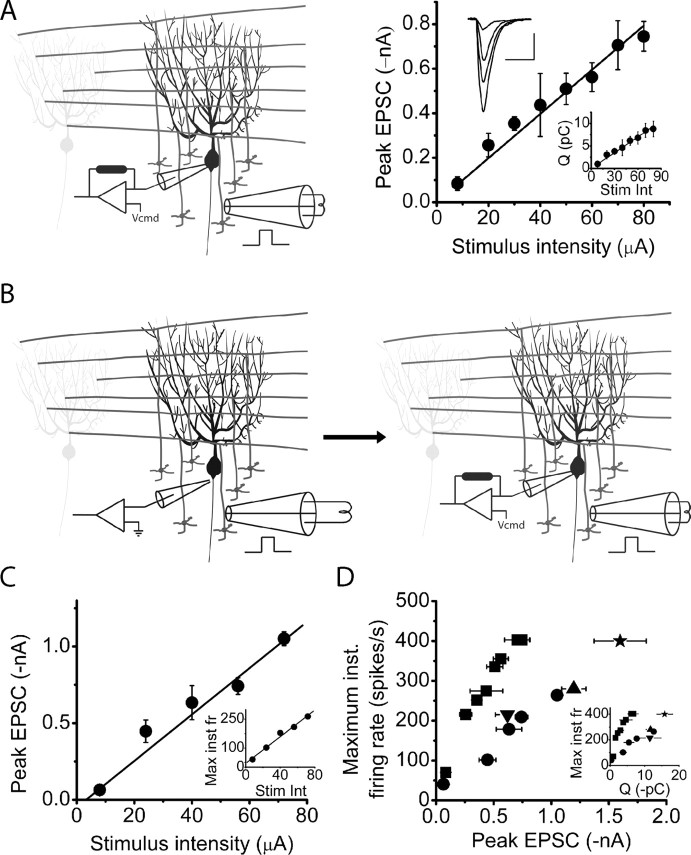
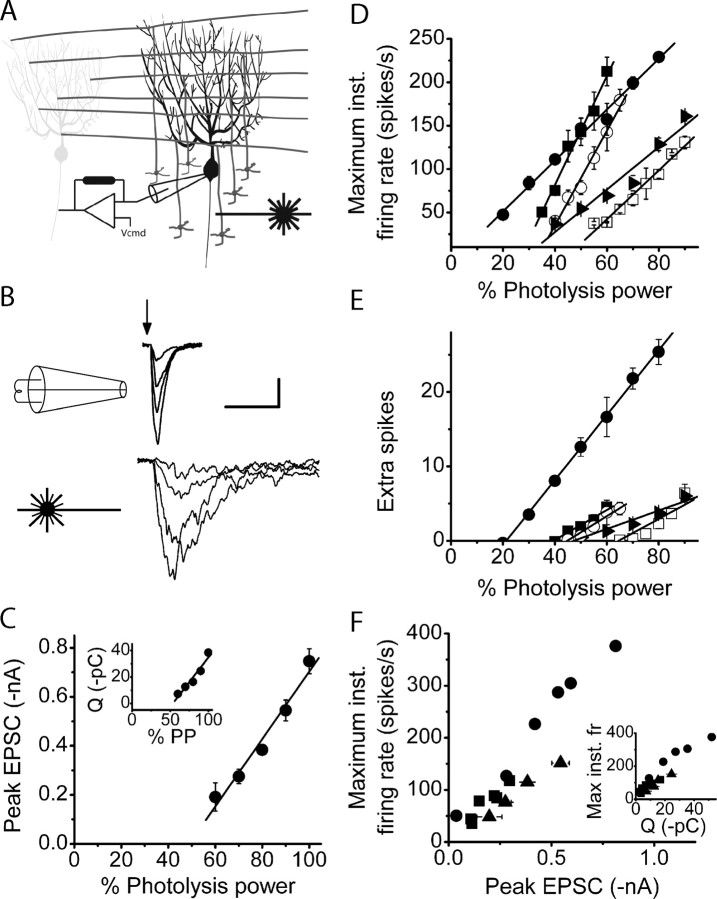
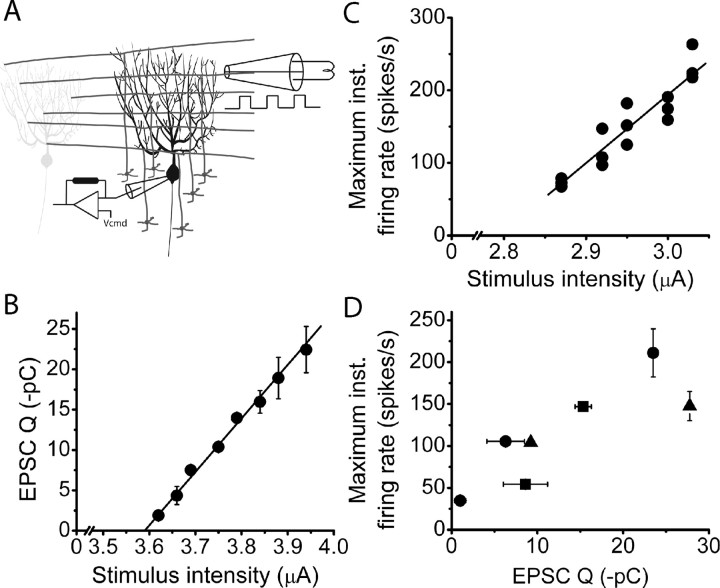
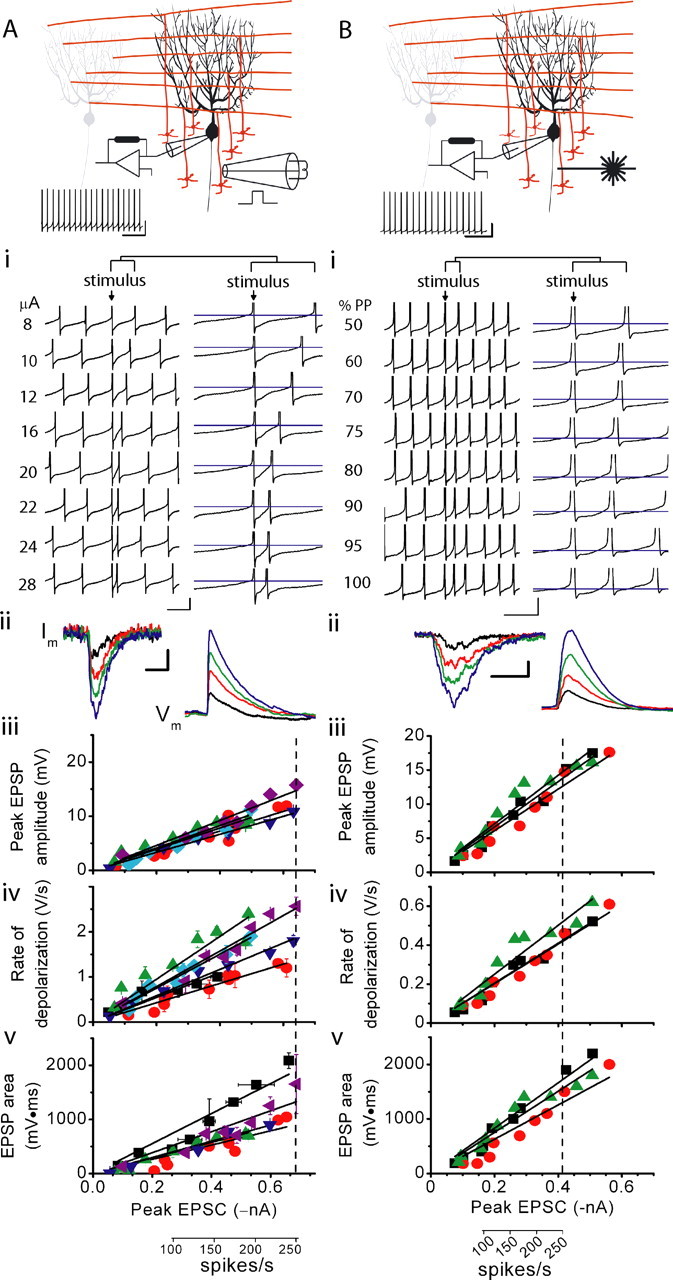
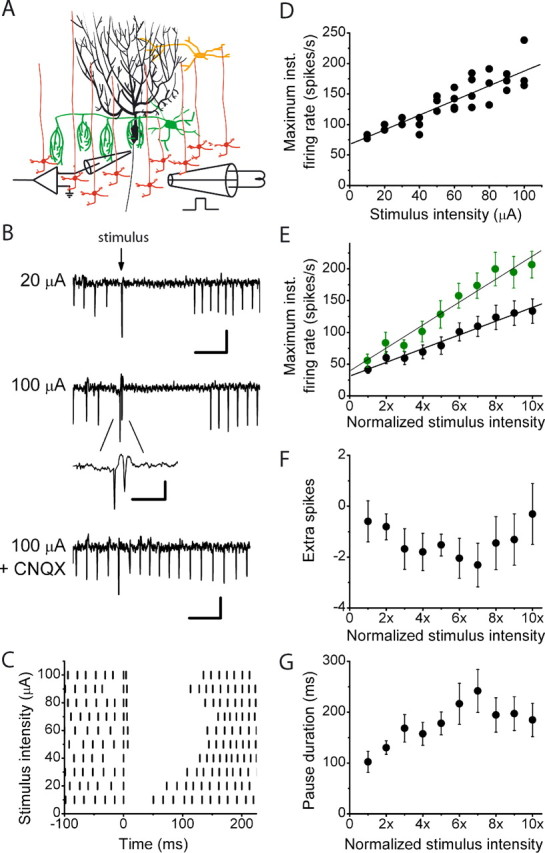
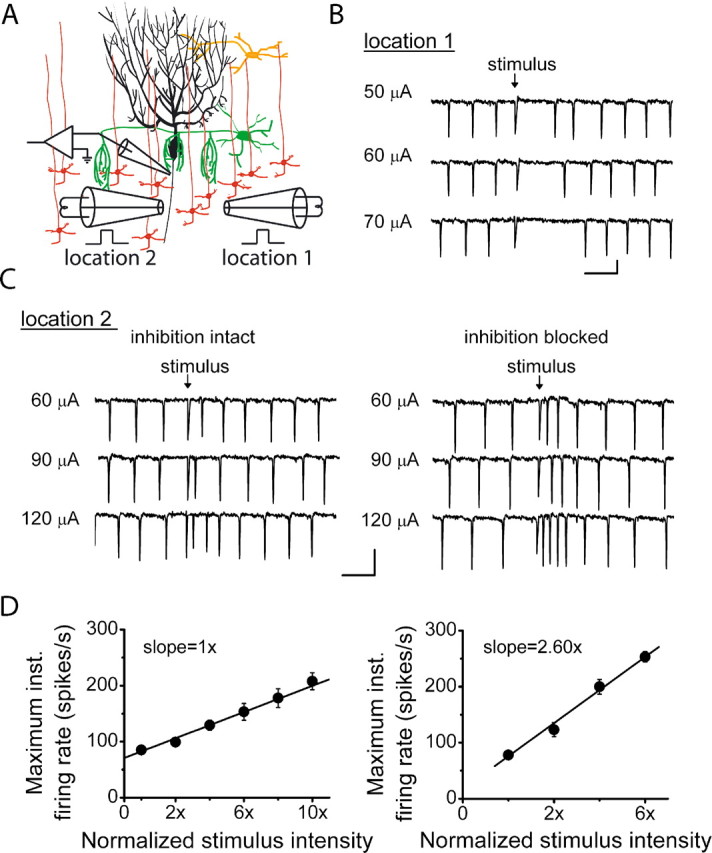
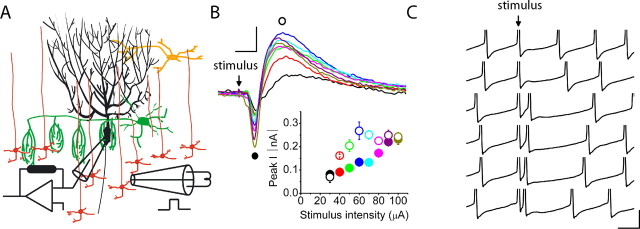
The orchestration of simple motor tasks by the cerebellum results in coordinated movement and the maintenance of balance. The cerebellum integrates sensory and cortical information to generate the signals required for the coordinated execution of simple motor tasks. These signals originate in the firing rate of Purkinje cells, each of which integrates sensory and cortical information conveyed by granule cell synaptic inputs. Given the importance of the granule cell input-Purkinje cell output function for cerebellar computation, this algorithm was determined. Using several stimulation paradigms, including those that mimicked patterns of granule cell activity similar to those observed in vivo, we quantified the poststimulus maximum firing rate and number of extra spikes in response to granule cell synaptic input. Both of these parameters linearly encoded the strength of synaptic input when inhibitory synaptic transmission was blocked. This linear algorithm was independent of the location or temporal pattern of synaptic input. With inhibitory synaptic transmission intact, the maximum firing rate, but not the number of extra spikes, encoded the strength of granule cell synaptic input. Furthermore, the maximum firing rate of Purkinje cells linearly encoded the strength of synaptic input whether or not the activation of granule cells resulted in a pause in Purkinje cell firing. On the basis of the data presented, we propose that Purkinje cells encode the strength of granule cell synaptic input in their maximum firing rate with a linear algorithm.


Figures

Figure 1.
Figure 1.
The maximum firing rate and extra spikes of a Purkinje cell are a linear function of the strength of electrical stimulation of its synaptic inputs. A, The activity of visually identified Purkinje cells was monitored with extracellular recordings, whereas the granule cell layer immediately below them was electrically stimulated in the presence of 100 μm picrotoxin and 1 μm CGP 55845 to block ionotropic and metabotropic inhibitory synaptic transmission. For the experiments shown, the stimulus was a single 200-μs-long constant current electrical pulse. The strength of the stimulus current was varied from trial to trial in random order. Ai, Individual circles denote the instantaneous firing rate of a Purkinje cell before and after stimulation of the granule cell layer. The granule cell layer was stimulated with 20, 30, and 40 μA intensities. Increasing the strength of stimulation increased the firing rate of the cell, which then decreased monotonically to baseline levels. Aii, In the raster plot shown, vertical bars indicate the time of occurrence of Purkinje cell action potentials 150 ms before and after the delivery of an electrical stimulation. Different stimulation intensities are shown. Increasing the strength of electrical stimulation in the same cell increased the poststimulus firing frequency. Aiii, The maximum (instantaneous) poststimulus firing rates for the cell shown in Aii are plotted. Each symbol represents a single trial, with the solid line representing the linear regression fit to the data (R2 = 0.92). Aiv, Average data from four cells show that the poststimulus maximum firing rate of Purkinje cells linearly increases as a function of the stimulus intensity. To average between cells, the stimulus intensity was normalized to the minimal stimulus intensity. The solid line represents the linear regression fit to the data (R2 = 0.98). Av, Average data from the same four cells as in Aiv show that the number of poststimulus extra spikes linearly increases as a function of the stimulus intensity. To average between cells, the stimulus intensity was normalized to the minimal stimulus intensity. The solid line represents the linear regression fit to the data (R2 = 0.94). Avi, The number of extra spikes increases linearly with poststimulus maximum firing rate responses to the same stimulations in a Purkinje cell. The solid line represents the linear regression fit to the data (R2 = 0.90). B, The experiments presented replicate those in A, with the modification that the stimulus was composed of a train of three 100-μs-long current pulses delivered at 75 Hz. This paradigm replicates the average activity of granule cells in vivo in response to discrete sensory inputs. The first stimulus of the burst was timed to occur simultaneously with the firing of an action potential in the target cell. A linear relationship between the poststimulus maximum firing rate and poststimulus extra spikes of Purkinje cells and the strength of electrical stimulation is also found with this paradigm. The stimulation intensities in Bi were 14, 16, and 18 μA. The linear regression fits to data presented in BiiiBvi had R2 values of 0.88, 0.98, 0.98, and 0.96, respectively. The data in Biv and Bv are averages from the same five cells. Calibration: 25 ms, 50 spikes/s. Stim., Stimulation; inst., instantaneous.
Figure 2.
Figure 2.
The maximum firing rate of a Purkinje cell is a linear function of the strength of its granule cell synaptic input. A, A Purkinje cell was voltage clamped at −60 mV, and EPSCs were recorded in response to single electrical stimulations of the granule cell layer at varying strengths. Peak EPSC amplitudes increased linearly with the strength of stimulation in the same cell. The top inset shows EPSCs corresponding to stimulations of 8, 30, 50, and 80 μA. Calibration: 25 ms, 200 pA. The bottom inset shows the total charge injected into the same cell by each EPSC. The relationship between the total EPSC charge and the strength of stimulation is also linear. The solid lines represent linear regression fits to the data, each with an R2 value >0.96. B, C, To obtain the relationship between EPSC amplitude and poststimulus maximum firing rate, EPSCs were recorded in voltage-clamped Purkinje cells in response to granule cell stimulation intensities for which the poststimulus maximum firing rates were previously determined extracellularly (C, inset). The solid lines represent linear regression fits to the data, each with an R2 value of 0.98. D, The poststimulus maximum firing rates of Purkinje cells are plotted as a function of the corresponding peak EPSC amplitudes as determined in B. The maximum firing rates of the Purkinje cells are also plotted as a function of the total charge injected by the corresponding EPSCs (inset). On average, approximately 1 nA of inward current, or approximately 8 pC of charge, was sufficient to increase the maximum firing rate to ≈250 spikes/s. Data are from five cells, with each symbol representing a different cell. All average data are shown as mean ± SD. Stim int, Stimulus intensity; Max inst fr, maximum instantaneous firing rate.
Figure 3.
Figure 3.
The strength of asynchronous granule cell activity is linearly encoded in the maximum firing rate and extra spikes of Purkinje cells. A, To avoid the nonphysiological synchronous activation of granule cells, localized photorelease of glutamate was substituted for electrical stimulation. UV light from a laser was focused onto a 40-μm-diameter spot and was positioned on the granule cell layer immediately below the Purkinje cell under study. One-millisecond-long pulses of varying intensity were used to photorelease glutamate from caged glutamate to activate the targeted granule cells. Similar to electrical stimulations, the photolysis pulse was delivered coincident with an action potential in the target Purkinje cell. B, EPSCs in Purkinje cells voltage clamped at −60 mV were recorded after activation of granule cells with electrical stimulation (top traces) or photorelease of glutamate (bottom traces) at four different stimulation strengths. The timing of the stimulation is depicted by the arrow. As judged by the kinetics and noise of the resulting EPSCs, glutamate photolysis activated the target granule cells relatively asynchronously. Calibration: 50 ms, 200 pA. C, The peak amplitude and the total charge (inset) of EPSCs increased linearly as a function of the intensity of the photolysis pulse in the same cell. Solid lines represent linear regression fits to the data (R2 = 0.96 and 0.94 for the inset). Average data are shown as mean ± SD. D, The poststimulus maximum firing rate was measured with extracellular recordings in response to photorelease of different concentrations of glutamate. In five cells examined, the maximum firing rate increased linearly with the amount of glutamate photoreleased. Different symbols represent different cells. Solid lines show linear regression fits to data for each cell (R2 > 0.94 in each case). E, The number of poststimulus extra spikes was measured with extracellular recordings in response to photorelease of different concentrations of glutamate. In five cells examined (same as in D), the number of poststimulus extra spikes increased linearly with the amount of glutamate photoreleased. Different symbols represent different cells. Solid lines show linear regression fits to data for each cell (R2 > 0.87 in each case). F, The poststimulus maximum firing rate and peak EPSC amplitudes in response to photorelease of glutamate were measured in the same cell with extracellular and whole-cell voltage-clamp recordings, respectively. The poststimulus maximum firing rate was a linear function of the peak EPSC amplitude, or total EPSC charge (inset). On average, approximately 30 pC was required to increase the maximum firing rate to ≈250 spikes/s. Different cells are represented by different symbols. Average data are shown as mean ± SD. Max inst fr, Maximum instantaneous firing rate; inst, instantaneous.
Figure 4.
Figure 4.
The maximum firing rate is a linear function of the synaptic current injected by a beam of parallel fiber synaptic input. A, A Purkinje cell was voltage clamped at −60 mV, and the total charge injected by an EPSC was recorded in response to electrical stimulation. The stimulus consisted of three 100 μs current pulses presented at 75 Hz with a pipette positioned in the molecular layer. B, The total charge injected by an EPSC increased linearly with the strength of parallel fiber stimulation for an individual Purkinje cell (R2 = 0.98). C, The poststimulus maximum firing rate increased linearly with the strength of parallel fiber stimulation for an individual Purkinje cell (R2 = 0.87). Each symbol represents a single trial. D, To obtain the relationship between total charge injected by an EPSC and poststimulus maximum firing rate, the total charge injected by an EPSC was recorded in a voltage-clamped Purkinje cell in response to a molecular layer stimulation intensity for which the poststimulus maximum firing rate was previously determined extracellularly. Each symbol represents a different cell. inst, Instantaneous.
Figure 5.
Figure 5.
Increasing the strength of granule cell synaptic input linearly increases somatic membrane potential. A, Purkinje cells were whole-cell current clamped, and current was injected to maintain the membrane potential at approximately −70 mV. The amplitude of the hyperpolarizing current injected was reduced for 2.5 s, and the cell was allowed to fire spontaneously. One second into spontaneous firing, a bipolar stimulating electrode was used to electrically stimulate the granule cell layer immediately below the Purkinje cell. As with extracellular recordings, the stimulus was delivered coincident with an action potential in the target Purkinje cell. The spontaneous firing of a Purkinje cell is shown. Calibration: 100 ms, 20 mV. Ai, The responses of the cell shown above to different strengths of electrical stimulation are shown. As can be seen in the compressed (left) and expanded (right) traces, the maximum firing rate of the Purkinje cell increased with the strength of stimulation. For clarity, action potentials are truncated. The blue line indicates −50 mV in the traces on the right (expanded). Calibration: 20 ms, 10 mV for left traces; 8 ms, 10 mV for right traces. Aii, Purkinje cells were voltage clamped at −60 mV with QX-314 in the pipette to block voltage-gated sodium channels, and the granule cell layer was electrically stimulated to record EPSCs. The same cell was then current clamped at −55 mV, and the same stimulation strengths were applied to the granule cell layer to record the corresponding EPSPs. Calibration: 10 ms, 100 pA for current traces (left); 50 ms, 2 mV for voltage traces (right). Aiii, Scatter plot of peak EPSP amplitudes versus the peak amplitude of corresponding EPSCs. Each symbol indicates a different cell. Solid lines show linear regression fits to data for each cell (R2 > 0.87 in each case with the mean R2 = 0.93 ± 0.02). The dashed line indicates the peak EPSC needed to drive Purkinje cells to 250 spikes/s. Aiv, Scatter plot of the rate of EPSP depolarization versus the peak amplitude of the corresponding EPSCs. Each symbol indicates a different cell. Solid lines show linear regression fits to data for each cell (R2 > 0.82 in each case with the mean R2 = 0.92 ± 0.06). Av, Scatter plot of the EPSP area versus the peak amplitude of the corresponding EPSCs. Each symbol indicates a different cell. Solid lines show linear regression fits to data for each cell (R2 > 0.82 in each case with the mean R2 = 0.90 ± 0.06). B, The experiments presented replicate those in A, with the modification that 1-ms-long UV pulses of varying intensity were used to photorelease glutamate from caged glutamate in the granule cell layer immediately beneath the Purkinje cell under study to mimic asynchronous release. In Bi, the blue line indicates −50 mV in the traces on the right (expanded). In Biii–Bv, solid lines show linear regression fits to data for each cell [R2 > 0.92 (Biii, Biv), R2 > 0. 90 in (Bv)]. Also, the dashed line indicates the peak EPSC needed to drive Purkinje cells to 250 spikes/s. Calibration: B, 50 ms, 20 mV; Bi, 20 ms, 10 mV for the left traces (compressed) and 5 ms, 8 mV right traces (expanded); Bii, 50 ms, 100 pA for the current traces (left) and 140 ms, 3 mV for the voltage traces (right).
Figure 6.
Figure 6.
In the presence of feedforward inhibition, the maximum firing rate of a Purkinje cell is a linear function of the strength of its granule cell synaptic input. A, In the absence of inhibitory synaptic transmission blockers, the activity of visually identified Purkinje cells was monitored with extracellular recordings, whereas the granule cell layer immediately beneath them was electrically stimulated with bipolar electrodes 80–100 μm in diameter The stimulus was a single 200-μs-long constant current electrical pulse that was delivered concurrently with an action potential in the target Purkinje cell. The strength of the stimulus current was varied from trial to trial in random order. B, Sample extracellular recordings show the response of an individual Purkinje cell to granule cell layer stimulations of 20 and 100 μA. The response of a Purkinje cell to a 100 μA stimulation is abolished in the presence of 10 μm CNQX, confirming that interneurons are activated by granule cell synaptic input and are not being directly stimulated. Calibration: (in descending order) 50 ms, 400 μV; 10 ms, 400 μV; 50 ms, 300 μV. C, In the raster plot, vertical bars indicate the time of occurrence of Purkinje cell action potentials 100 ms before and 225 ms after the delivery of an electrical stimulation. Different stimulation intensities are shown. Increasing the strength of electrical stimulation in the same cell increased the poststimulus firing frequency. D, The maximum poststimulus firing rates for the cell shown in C are plotted. Each symbol represents a single trial, with the solid line representing the linear regression fit to the data (R2 = 0.81). E, Average data from 10 cells (black circles) show that the poststimulus maximum firing rate of Purkinje cells linearly increases as a function of the stimulus intensity. To average between cells, the stimulus intensity was normalized to the minimal stimulus intensity. The solid line represents the linear regression fit to the data (R2 = 0.98). Average data (mean ± SEM) from five cells with maximum firing rates that reached 200 spikes/s (green circles) show that the poststimulus maximum firing rate of Purkinje cells linearly increases as a function of the stimulus intensity. The stimulus intensity was normalized to the minimal stimulus intensity. The solid line represents the linear regression fit to the data (R2 = 0.96). F, Average data from the same 10 cells as in E show that there is no relationship between the strength of granule cell layer stimulation and the number of poststimulus extra spikes. The stimulus intensity was normalized to the minimal stimulus intensity. G, Average data from the same 10 cells as in E and F show that although the pause duration initially increases with the strength of granule cell layer stimulation, the relationship is not linear over the entire range examined.
Figure 7.
Figure 7.
The computational algorithm of Purkinje cells is not affected by inhibitory inputs. A, In the absence of inhibitory synaptic transmission blockers, the activity of visually identified Purkinje cells was monitored with extracellular recordings, and the granule cell layer was electrically stimulated with bipolar electrodes 40 μm in diameter. The location of the bipolar electrode was placed underneath the Purkinje cell in locations that generated inhibitory (location 1) and excitatory (location 2) Purkinje cell responses. B, Sample recordings show the response of a Purkinje cell to granule cell layer stimulations of 50, 60, and 70 μA at location 1. Calibration: 20 ms, 250 μV. C, Sample recordings show the response of the same Purkinje cell in A to granule cell layer stimulations of 60, 90, and 120 μA at location 2 in the presence and absence of 100 μm picrotoxin and 1 μm CGP 55845. Calibration: 20 ms, 500 μV. D, Average data from three cells show that with inhibition intact, the poststimulus maximum firing rate of Purkinje cells linearly increases with the strength of granule cell layer stimulation. Average data from the same three cells with inhibition blocked also reveals a linear input–output function, but with a 2.6-fold higher slope. To average between cells, the stimulus intensity was normalized to the minimal stimulus intensity. Solid lines show linear regression fits to data (R2 > 0.98 in each case). inst., Instantaneous.
Figure 8.
Figure 8.
The membrane potential of Purkinje cells in the presence of intact inhibition. A, In the absence of blockers of inhibitory synaptic transmission, a Purkinje cell was whole-cell patch clamped, and the membrane currents or potentials were recorded in response to various strengths of single electrical stimulations of the granule cell layer applied with bipolar electrodes 80–100 μm in diameter (similar to those used in Fig. 6). B, The currents recorded in a voltage-clamped Purkinje cell in response to various stimulation strengths (color-coded as in the graph). Calibration: 5 ms, 100 pA. The bottom inset plots peak EPSC (filled circles) and IPSC (open circles) amplitudes versus stimulus intensity. C, In the absence of blockers of inhibitory synaptic transmission, the response of a Purkinje cell to electrical stimulation of the granule cell layer immediately beneath it using the whole-cell current-clamp protocol of Figure 5Ai is shown. Calibration: 10 ms, 10 mV. For clarity, action potentials are truncated.

References

    1. Albus JS. A theory of cerebellar function. Math Biosci. 1971;10:25–61.
    1. Allen GI, Azzena GB, Ohno T. Somatotopically organized inputs from fore- and hindlimb areas of sensorimotor cortex to cerebellar Purkyne cells. Exp Brain Res. 1974;20:255–272. - PubMed
    1. Ariav G, Polsky A, Schiller J. Submillisecond precision of the input-output transformation function mediated by fast sodium dendritic spikes in basal dendrites of CA1 pyramidal neurons. J Neurosci. 2003;23:7750–7758. - PMC - PubMed
    1. Benardo LS, Masukawa LM, Prince DA. Electrophysiology of isolated hippocampal pyramidal dendrites. J Neurosci. 1982;2:1614–1622. - PMC - PubMed
    1. Bower JM, Woolston DC. Congruence of spatial organization of tactile projections to granule cell and Purkinje cell layers of cerebellar hemispheres of the albino rat: vertical organization of cerebellar cortex. J Neurophysiol. 1983;49:745–766. - PubMed

Publication types

LinkOut - more resources