Comparative Study
. 2006 Dec 13;26(50):12885-95.
doi: 10.1523/JNEUROSCI.3688-06.2006.

Facilitation of saccadic eye movements by postsaccadic electrical stimulation in the primate caudate

Affiliations
Comparative Study

Facilitation of saccadic eye movements by postsaccadic electrical stimulation in the primate caudate

Kae Nakamura et al. J Neurosci. .

Abstract

Sensorimotor experience followed by positive feedback leads to motor learning. Although the striatum, an input channel of the basal ganglia, has been implicated to play a key role in motor learning, little is known about how reward information modulates the neuronal processes in the striatum that causes behavioral changes. Here, we report that direct manipulation of the neuronal signal in the primate caudate yields behavioral changes comparable with those induced by natural reward. Electrical stimulation in the oculomotor region of the caudate immediately after saccades to a fixed direction led to selective facilitation of saccades in that direction. The facilitation remained even after stimulation was stopped, indicating a plastic change. These effects were observed when stimulation was applied after, not before, saccades. We propose that the caudate plays a causal role in behavioral changes by integrating selective sensorimotor and reward information in a temporally specific manner.


Figures
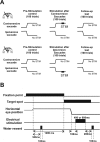
Figure 1.
Figure 1.
Experimental design. A, The schedule of the experiment. In this example, a recording/stimulation electrode is located in the oculomotor region in the left caudate. In each experiment, the monkey performed three sessions of a visually guided saccade task: prestimulation control, stimulation after saccades, and follow-up test. Each session consisted of 100 trials in which the saccade target was presented randomly on the right or left. Only during the “stimulation after saccades” session was electrical stimulation applied to the caudate after saccades in a fixed direction (e.g., to the right or contraversive as shown in the top panel). In another experiment, the stimulation was applied after saccades to the other direction (e.g., to the left or ipsiversive as shown in the bottom panel). In each panel, the schematic horizontal eye position is shown, upward indicating rightward (or contraversive) and downward indicating leftward (or ipsiversive). B, Time events. After the animal fixated on the central fixation point for 1200 ms, a target appeared either in the right or left to which the monkey made a saccade. On a stimulation trial, after the monkey fixated on the target for 100 ms, electrical stimulation was applied for either 400 or 800 ms (current, up to 50 μA; pulse duration, 0.5 ms; frequency, 100 Hz). A liquid reward (0.1 ml) was given twice per trial: 500 ms after fixation onset and 200 ms after the end of the stimulation. On a nonstimulation trial, the animal kept fixating on the target for the same period of time as stimulation period (i.e., 400 or 800 ms plus 100 ms) to obtain the same amount of reward.
Figure 2.
Figure 2.
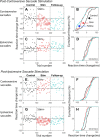
Postsaccadic caudate stimulation facilitates saccades. In these examples, electrical stimulation was applied to the left caudate after all contraversive (rightward) saccades (AD) or all ipsiversive (leftward) saccades (EH). In A, C, E, and G, the reaction time change of each trial (compared with the median reaction time for the prestimulation control) is plotted against the trial number. The black dots represent the prestimulation control session (Control); red open circles, trials followed by stimulation (Stim+); red dots, trials not followed by stimulation during the stimulation session (Stim–); blue dots, the follow-up test (Follow). B, D, F, and H show the cumulative frequency histograms of the reaction time changes. The black, red, and blue lines indicate prestimulation control, stimulation, and follow-up test sessions, respectively.
Figure 3.
Figure 3.
Population analyses of post-contraversive saccade stimulations (AD) (n = 44; monkey S, n = 35; monkey L, n = 9) and post-ipsiversive saccade stimulations (EH) (n = 46; monkey S, n = 38; monkey L, n = 8). A, Median reaction times of contraversive saccades during the stimulation session (ordinate) plotted against the median reaction times during the prestimulation control (abscissa). Each data point corresponds to a single experiment. The filled and open symbols indicate significant and nonsignificant changes, respectively (Mann–Whitney U test, p < 0.05). The black or gray circles/lines indicate the experiments in which all (100% schedule) or one-half (50% schedule) of the trials in the fixed direction of saccades were followed by stimulation, respectively. B, Time course of the changes in the median reaction times for contraversive saccades. Control, Prestimulation control session; Stim, stimulation session; Follow, follow-up session. Negative and positive values indicate decrease and increase in the median reaction times compared with the prestimulation control. Data from one experiment are connected by lines. The data from the experiments that showed significant changes in the reaction times (increase or decrease) during the stimulation session are shown. C, D, Changes in the median reaction times of ipsiversive saccades for post-contraversive saccade stimulation. The format is the same as in A and B. EH, Effects of post-ipsiversive saccades stimulation. The format is the same as in AD.
Figure 4.
Figure 4.
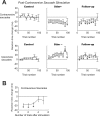
Trial-by-trial changes in the saccade reaction times during the post-contraversive saccade stimulation. A, Changes in the reaction times of contraversive saccades (top row) and ipsiversive saccades (bottom row) during control (left column), stimulation (middle), and follow-up (right) sessions. Each session was divided into 10 periods (5 trials for each direction in a period), and the reaction time changes (relative to the median reaction time in the control session) were averaged for each period. The data were further averaged across experiments, and the mean and SE are shown. The data were obtained from 11 post-contraversive saccade stimulations with the 100% stimulation schedule in which a significant shortening in the contraversive saccade reaction times during the stimulation session was observed. Note that, during the stimulation session, the reaction times of contraversive saccades, which were associated with caudate stimulation, were shortened significantly soon after the stimulation session started. This facilitation of saccades remained during the follow-up session. Ipsiversive saccades, which were not associated with the stimulation, showed the opposite changes. Asterisk indicates a significant difference from zero (Mann–Whitney U test, p < 0.05). B, The reaction times (mean and SE) of contraversive saccades during the post-contraversive saccade stimulation session are plotted as a function of the number of trials since the last trials associated with caudate stimulation. Note that the facilitatory effect remained for three trials since the last stimulation was applied. The result is based on the same data sets as in A. Asterisk indicates a significant difference from zero (Kruskal–Wallis test with Bonferroni's correction, the significance criteria, p < 0.01 = 0.05/5).
Figure 5.
Figure 5.
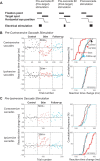
Effects of caudate stimulation depend on its timing. A, Schematics of three different timings of stimulation. B, C, Representative effects of the presaccade no. 1 stimulation, applied before the appearance of a target in the contralateral (B) or ipsilateral (C) side to the electrode. The results are shown in the same format as in Figure 2. During the stimulation session (Stim), the stimulation was applied before 50% of the contraversive saccades. The red open circles represent trials followed by stimulation; red dots, trials not followed by stimulation. Note that, when preceded by caudate stimulation, the reaction times of contraversive saccades became shortened (B), whereas those of ipsiversive saccades became prolonged (C). No significant persistent effect was observed during the follow-up test (blue dots and lines).
Figure 6.
Figure 6.
The persistent effect of caudate stimulation depends on the timing of stimulation. A, Presaccade no. 1 or pretarget stimulation (monkey S, n = 7; monkey L, n = 8). B, Presaccade no. 2 or posttarget stimulation (monkey S, n = 6; monkey L, n = 2). C, Postsaccade stimulation (black, 100%; monkey S, n = 11) (gray, 50% schedule; monkey S, n = 2; monkey L, n = 3). For each schedule, the mean and SE of the reaction time changes are shown for the stimulation session (Stim) and the follow-up session (Follow-up). Experiments in which the reaction times of contraversive saccades associated stimulation showed significant decrease are analyzed. In A and B, in addition, the reaction times of contraversive saccades not associated with the stimulation are shown by the broken lines.
Figure 7.
Figure 7.
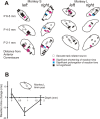
A, Recording and stimulation sites in monkey S (left) and monkey L (right) are projected onto coronal sections with 2 mm intervals traced from magnetic resonance images. The numbers on the left indicate distance (in millimeters) posterior to the anterior commissure. The open circles denote the locations of neurons that showed any type of task-related activity during the performance of the biased-reward saccade task (see Materials and Methods). The bars denote the locations of electrical stimulation. Reaction time changes of contraversive saccades by post-contraversive saccadic stimulation are color coded: pink, significant decrease; cyan, significant increase; black, no significant changes. B, The effect of electrical stimulation was localized in the caudate. Stimulation was applied at three different depths in a single electrode track: upper border (triangle), central part (circle), and lower border (square) of the caudate. The mean and SE of the reaction time changes are shown for each depth from the upper border of the caudate. The results are based on one set of three stimulation experiments performed along the same penetration (monkey L, 6 mm posterior to the anterior commissure).

Similar articles

Cited by

References

    1. Barnes TD, Kubota Y, Hu D, Jin DZ, Graybiel AM. Activity of striatal neurons reflects dynamic encoding and recoding of procedural memories. Nature. 2005;437:1158–1161. - PubMed
    1. Bevan MD, Smith AD, Bolam JP. The substantia nigra as a site of synaptic integration of functionally diverse information arising from the ventral pallidum and the globus pallidus in the rat. Neuroscience. 1996;75:5–12. - PubMed
    1. Bruce CJ, Goldberg ME. Primate frontal eye fields. I. Single neurons discharging before saccades. J Neurophysiol. 1985;53:603–635. - PubMed
    1. Bursten B, Delgado JM. Positive reinforcement induced by intracerebral stimulation in the monkey. J Comp Physiol Psychol. 1958;51:6–10. - PubMed
    1. Calabresi P, Pisani A, Mercuri NB, Bernardi G. The corticostriatal projection: from synaptic plasticity to dysfunctions of the basal ganglia. Trends Neurosci. 1996;19:19–24. - PubMed

Publication types

LinkOut - more resources