Comparative Study
. 2006 Dec 13;26(50):13007-16.
doi: 10.1523/JNEUROSCI.4323-06.2006.

A neurovascular niche for neurogenesis after stroke

Affiliations
Comparative Study

A neurovascular niche for neurogenesis after stroke

John J Ohab et al. J Neurosci. .

Abstract

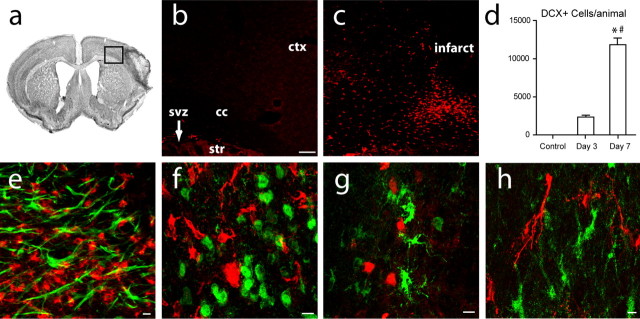
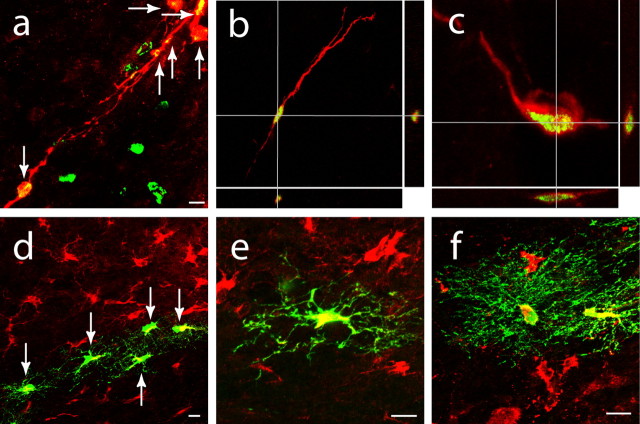
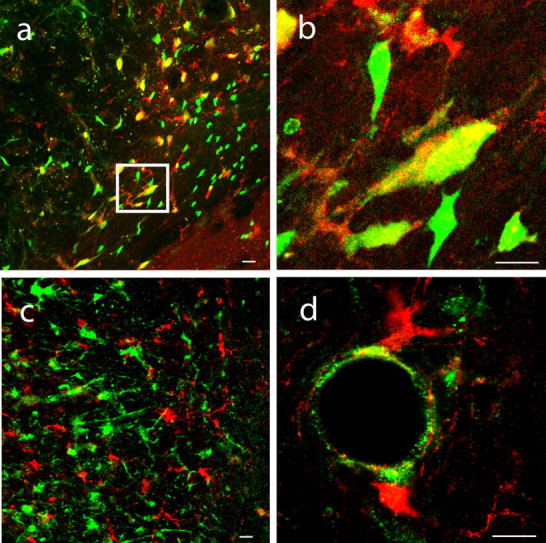
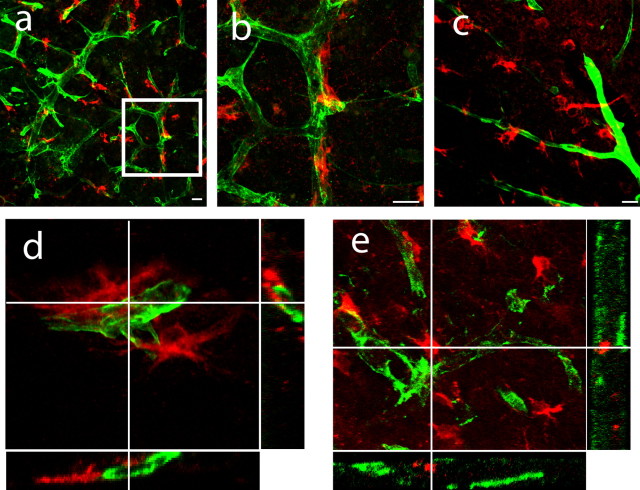
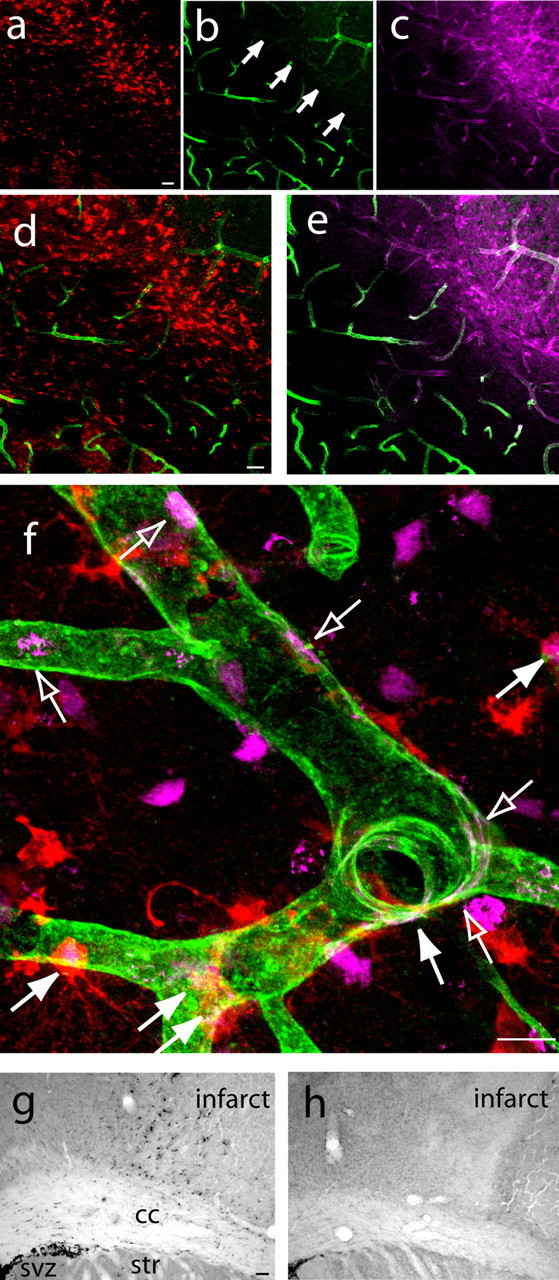
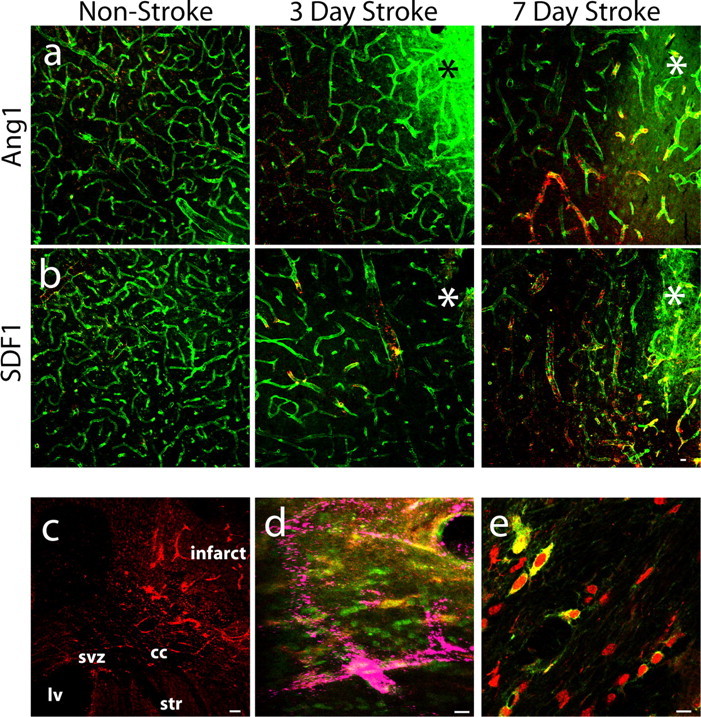
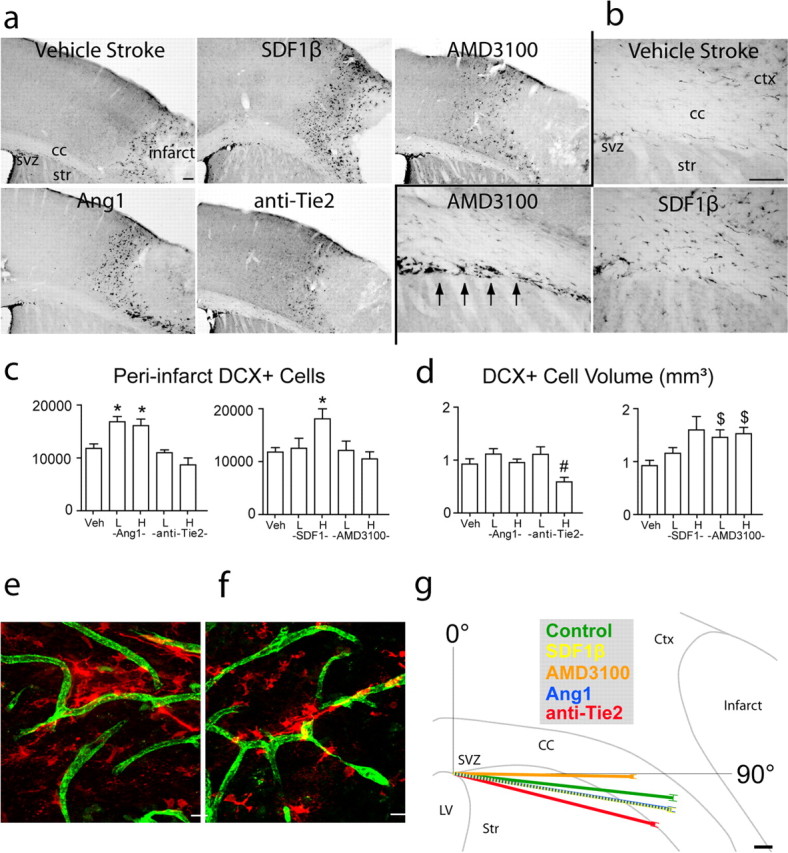
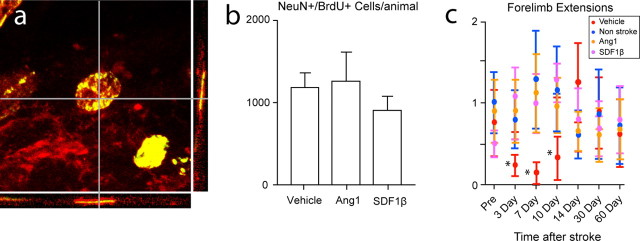
Stroke causes cell death but also birth and migration of new neurons within sites of ischemic damage. The cellular environment that induces neuronal regeneration and migration after stroke has not been defined. We have used a model of long-distance migration of newly born neurons from the subventricular zone to cortex after stroke to define the cellular cues that induce neuronal regeneration after CNS injury. Mitotic, genetic, and viral labeling and chemokine/growth factor gain- and loss-of-function studies show that stroke induces neurogenesis from a GFAP-expressing progenitor cell in the subventricular zone and migration of newly born neurons into a unique neurovascular niche in peri-infarct cortex. Within this neurovascular niche, newly born, immature neurons closely associate with the remodeling vasculature. Neurogenesis and angiogenesis are causally linked through vascular production of stromal-derived factor 1 (SDF1) and angiopoietin 1 (Ang1). Furthermore, SDF1 and Ang1 promote post-stroke neuroblast migration and behavioral recovery. These experiments define a novel brain environment for neuronal regeneration after stroke and identify molecular mechanisms that are shared between angiogenesis and neurogenesis during functional recovery from brain injury.


Figures

Figure 1.
Figure 1.
Focal cortical stroke induces neuroblast localization in peri-infarct cortex. a, cresyl violet section through frontal cortex after stroke. b, c, DCX+ cells (red) in non-stroke (b) and day 7 post-stroke (c) taken from region of box in a. Scale bar, 100 μm. d, Stereological quantification of DCX+ cells in peri-infarct cortex at day 7 after stroke. p < 0.04 for day 3 versus control, not significant by Bonferroni's post hoc testing; p < 0.0001 for day 7 versus control and day 3. e, f, DCX+ cells (red) do not colocalize with GFAP+ (e, green) or NeuN+ cells (f, green) in peri-infarct cortex. Scale bar, 25 μm. g, DCX+ cells (green) do not colocalize with NG2+ cells (red) in peri-infarct cortex. Scale bar, 25 μm. h, DCX+ cells (red) do not colocalize with GSTπ+ (green) cells in peri-infarct cortex. Scale bar, 25 μm. *p < 0.0001; # p < 0.0001. Error bars indicate SD. cc, Corpus callosum; ctx, cortex; str, striatum.
Figure 2.
Figure 2.
Newly born neuroblasts migrate from the SVZ to peri-infarct cortex after stroke. ac, Cells double labeled (arrows) for DCX (red), BrdU (green), and overlap (yellow) in white matter (b), the white matter/cortical interface (a), and peri-infarct cortex (c) at day 7 after stroke after SVZ microinjection of BrdU. Three-dimensional confocal reconstructions of cells in b and c are presented as viewed in the xz (bottom) and yz (right) planes. d, e, Cells double labeled (arrows) for DCX (red) and GFP (green) migrate through peri-infarct cortex at day 7 after stroke after SVZ microinjection of lentivirus/GFP. f, Cells double labeled for DCX and GFP extending extensive local processes into peri-infarct cortex at day 14 after stroke after SVZ microinjection of lentivirus/GFP. Scale bars, 25 μm.
Figure 3.
Figure 3.
Post-stroke neurogenesis derives from a GFAP-expressing progenitor in the SVZ. a, b, DCX+ cells (red) colocalize entirely with GFP (green) expression in peri-infarct cortex of GFAP reporter mice producing large regions of overlap (yellow). A subpopulation of GFP+/DCX-negative cells is presumed to be astrocytes. The region within the box in a is enlarged in b. Scale bars, 25 μm. c, DCX+ cells (red) do not colocalize with β-galactosidase expression (green) in peri-infarct cortex of VE–cadherin reporter mice. Scale bar, 25 μm. d, DCX+ cells (red) are located in close physical proximity to β-galactosidase+ endothelial cells (green). Scale bar, 25 μm.
Figure 4.
Figure 4.
Peri-infarct neuroblasts form close physical associations with vascular endothelial cells. a, b, DCX+ cells (red) form close physical associations with peri-infarct blood vessels immunoreactive for laminin (green). The region within the box in a is enlarged in b. c, PSA-NCAM+ cells (red) align with endothelial cells stained for PECAM-1 (green). Scale bar, 25 μm. d, e, Three-dimensional confocal reconstructions demonstrate DCX+ cells (red) interdigitate within the folds of laminin+ (d) and PECAM-1+ endothelial cells (e, green) in peri-infarct cortex.
Figure 5.
Figure 5.
Neurogenesis and angiogenesis are causally linked in a novel neurovascular niche in peri-infarct cortex. ae, DCX+ cells (a) localize to a region of vascular remodeling in peri-infarct cortex characterized by poor lectin perfusion (b) but robust PECAM-1 immunoreactivity (c) at day 5 after stroke. d and e represent merged images of a,b and b,c, respectively. Arrows in b indicate the region of poor lectin perfusion adjacent to the infarct core. Scale bars, 50 μm. f, High-magnification confocal image showing that newly born neuroblasts localize in a region of newly born endothelial cells at day 7 after stroke. Filled arrows indicate newly born neuroblasts double labeled for DCX (red) and BrdU (purple), and open arrows indicate newly born endothelial cells double labeled for PECAM-1 (green) and BrdU (purple). Scale bar, 25 μm. g, h, DCX+ cells, stained with DAB, are significantly reduced in peri-infarct cortex of endostatin-treated (h) compared with vehicle-stroke animals (g) at day 7 after stroke. Scale bar, 100 μm. cc, Corpus callosum; str, striatum.
Figure 6.
Figure 6.
Ang1 and SDF1 are positioned to mediate post-stroke neurogenesis. a, Ang1 expression (red) in PECAM-1+ endothelial cells (green) remains unchanged at 3 d after stroke and increases at 7 d after stroke compared with non-stroke animals. Yellow indicates vessels with staining present for both PECAM-1 and Ang1. b, SDF1 expression (red) in PECAM-1+ endothelial cells (green) and overlap (yellow) increases at day 3 after stroke and persists in blood vessels through day 7 after stroke compared with non-stroke animals. Asterisks indicate the region of infarction. Scale bar, 50 μm. c, Ang1 (red) is expressed along the pathway of neuroblast migration from the SVZ toward the infarct at day 5 after stroke. Scale bar, 60 μm. d, Merged confocal images show that PSA-NCAM+ cells (red) coexpress the Tie2 receptor (green; PSA-NCAM+/Tie2+ cells are yellow) in close proximity to Ang1-expressing blood vessels (purple). Scale bar, 30 μm. e, DCX+ cells (red) colocalize with the SDF1 receptor CXCR4 (green), producing a large region of overlap (yellow), as they enter peri-infarct cortex at day 7 after stroke. Scale bar, 30 μm. cc, Corpus callosum; ctx, cortex; lv, lateral ventricle; str, striatum.
Figure 7.
Figure 7.
Ang1 and SDF1β gain- and loss-of-function experiments within neurovascular niche. a, DCX+ cells, stained with DAB, in peri-infarct cortex of vehicle-treated and Ang1 and SDF1β gain- and loss-of-function animals at day 7 after stroke. Scale bar, 100 μm. b, DCX+ cells in subcortical white matter of vehicle-, SDF1β-, and AMD3100-treated animals at day 7 after stroke. Arrows indicate the aberrant linear cluster of DCX+ cells along the striatum/white matter interface in AMD3100-treated stroke animals. Scale bar, 100 μm. c, Stereological quantification of DCX+ cells in peri-infarct cortex of Ang1 (left) and SDF1β (right) gain- and loss-of-function animals at day 7 after stroke. p < 0.68 after low-dose SDF1β; p = 0.04 for high-dose anti-Tie2 versus vehicle, not significant by Bonferroni's post hoc testing after Ang1. d, Volume of DCX+ cell distribution in peri-infarct cortex of Ang1 (left) and SDF1β (right) gain- and loss-of-function animals at day 7 after stroke. p < 0.01 after high-dose SDF1β; p < 0.015 for high-dose anti-Tie2 versus low dose after Ang1. For c and d, H and L indicate high and low doses, and Veh is vehicle-treated. *p < 0.016; # p < 0.015; $ p < 0.009. e, f, SDF1β (e) and Ang1 (f) treatment induce a clustering of DCX+ cells (red) around PECAM-1+ blood vessels (green). Scale bars, 25 μm. g, Summary of migration vector analysis in subcortical white matter at day 7 after stroke. The position of DCX+ cells in white matter in each treatment condition was digitized and rendered as a polar plot with a vector angle (θ) and a vector length (r). Each vector shows the mean angle and vector length of DCX+ cell migration in the indicated treatment conditions. The underlying outline is traced from a representative cresyl violet section through frontal cortex after stroke. The vector tips are bracketed by the SD for each mean. Note the vector for SDF1β is dashed to be visible as it overlaps with the Ang1 vector. The complete distribution of migratory angles is presented in histograms for each treatment condition in supplemental Figure 2 (available at www.jneurosci.org as supplemental material). Scale bar, 100 μm. Error bars in all panels indicate SD. cc, Corpus callosum; ctx, cortex; lv, lateral ventricle; str, striatum; veh, vehicle.
Figure 8.
Figure 8.
Ang1 and SDF1β improve behavioral recovery after stroke. a, Example of stroke-generated cell double labeled for NeuN (red) and BrdU (green) with significant overlap (yellow) at 90 d after stroke. The three-dimensional confocal reconstruction is presented as viewed in the xz (bottom) and yz (right) planes. b, Stereological quantification of NeuN+/BrdU+ cells in peri-infarct cortex at day 90 after stroke after vehicle, Ang1, or SDF1β treatment. 1183 ± 386 per animal after vehicle; 906 ± 420 after SDF1β; 1260 ± 842 after Ang1. p > 0.32. c, Behavioral recovery after stroke as tested on a whisker-guided forelimb extension task. *p < 0.05. Error bars in all graphs indicate SD.

References

    1. Abumiya T, Lucero J, Heo JH, Tagaya M, Koziol JA, Copeland BR, del Zoppo GJ. Activated microvessels express vascular endothelial growth factor and integrin alpha (v) beta3 during focal cerebral ischemia. J Cereb Blood Flow Metab. 1999;19:1038–1050. - PubMed
    1. Aguirre A, Gallo V. Postnatal neurogenesis and gliogenesis in the olfactory bulb from NG2-expressing progenitors of the subventricular zone. J Neurosci. 2004;24:10530–10541. - PMC - PubMed
    1. Alva JA, Zovein AC, Monvoisin A, Murphy T, Salazar A, Harvey NL, Carmeliet P, Iruela-Arispe ML. VE-Cadherin-Cre-recombinase transgenic mouse: a tool for lineage analysis and gene deletion in endothelial cells. Dev Dyn. 2006;235:759–767. - PubMed
    1. Alvarez-Buylla A, Lim DA. For the long run: maintaining germinal niches in the adult brain. Neuron. 2004;41:683–686. - PubMed
    1. Arai F, Hirao A, Ohmura M, Sato H, Matsuoka S, Takubo K, Ito K, Koh GY, Suda T. Tie2/angiopoietin-1 signaling regulates hematopoietic stem cell quiescence in the bone marrow niche. Cell. 2004;118:149–161. - PubMed

Publication types

MeSH terms