Comparative Study
. 2006 Dec 13;26(50):13054-66.
doi: 10.1523/JNEUROSCI.4330-06.2006.

Molecular dynamics of a presynaptic active zone protein studied in Munc13-1-enhanced yellow fluorescent protein knock-in mutant mice

Affiliations
Comparative Study

Molecular dynamics of a presynaptic active zone protein studied in Munc13-1-enhanced yellow fluorescent protein knock-in mutant mice

Stefan Kalla et al. J Neurosci. .

Abstract

GFP (green fluorescent protein) fusion proteins have revolutionized research on protein dynamics at synapses. However, corresponding analyses usually involve protein expression methods that override endogenous regulatory mechanisms, and therefore cause overexpression and temporal or spatial misexpression of exogenous fusion proteins, which may seriously compromise the physiological validity of such experiments. These problems can be circumvented by using knock-in mutagenesis of the endogenous genomic locus to tag the protein of interest with a fluorescent protein. We generated knock-in mice expressing a fusion protein of the presynaptic active zone protein Munc13-1 and enhanced yellow fluorescent protein (EYFP) from the Munc13-1 locus. Munc13-1-EYFP-containing nerve cells and synapses are functionally identical to those of wild-type mice. However, their presynaptic active zones are distinctly fluorescent and readily amenable for imaging. We demonstrated the usefulness of these mice by studying the molecular dynamics of Munc13-1-EYFP at individual presynaptic sites. Fluorescence recovery after photobleaching (FRAP) experiments revealed that Munc13-1-EYFP is rapidly and continuously lost from and incorporated into active zones (tau1 approximately 3 min; tau2 approximately 80 min). Munc13-1-EYFP steady-state levels and exchange kinetics were not affected by proteasome inhibitors or acute synaptic stimulation, but exchange kinetics were reduced by chronic suppression of spontaneous activity. These experiments, performed in a minimally perturbed system, provide evidence that presynaptic active zones of mammalian CNS synapses are highly dynamic structures. They demonstrate the usefulness of the knock-in approach in general and of Munc13-1-EYFP knock-in mice in particular for imaging synaptic protein dynamics.


Figures

Figure 1.
Figure 1.
Generation of Munc13-1–EYFP KIs. A, Strategy for the generation of the Munc13-1–EYFP KI mutation in mouse embryonic stem cells. WT Munc13-1 gene, targeting vector, mutated gene after homologous recombination (mn), and mutated gene after Cre recombination (m). Exons are indicated by gray boxes. The black triangles indicate loxP sites. A black horizontal bar indicates the probe used for Southern analysis (SpeI-digested tail DNA) of mutated genes in mice. PCR products used for genotyping are indicated by the horizontal blue bars. A 6 kbp section of genomic sequence is not shown here and is indicated by an arrowhead in the top panel. NEO, Neomycin resistance gene; pBlue, pBluescript KS; TK, herpes simplex virus thymidine kinase. B, Southern blot analysis of mutated genes using SpeI-digested mouse tail DNA and the probe indicated in A. mn, Mutated gene with neomycin resistance cassette (9.2 kbp); m, mutated gene after Cre recombination (8.0 kbp); +/+, WT gene (13.9 kbp). C, Western blot analysis of brain homogenates from WT (+/+) mice and mice carrying the mutated gene with neomycin resistance cassette (mn) or the mutated gene after Cre recombination (m). Note that Munc13-1–EYFP protein expression (arrowhead) is reduced in heterozygous mutant mice (mn/+, m/+) but not in homozygous mutant mice (mn/mn, m/m) (Fig. 2).
Figure 2.
Figure 2.
Munc13-1–EYFP mRNA and protein expression in Munc13-1–EYFP KI brains. A, Expression of Munc13-1 and Munc13-1–EYFP protein (arrowhead) in m/+ mice during development. Brains from mice of the indicated ages were homogenized, and proteins (10 μg per lane) were analyzed by SDS-PAGE and Western blotting with antibodies to the indicated proteins. B, Munc13-1 and Munc13-1–EYFP (arrowhead) in subcellular fractions of cerebral cortices from m/+ mice. Fractions (10 μg protein per lane) were analyzed by SDS-PAGE and Western blotting with antibodies to the indicated proteins. Hom, Homogenate; P1, nuclear pellet; P2, crude synaptosomal pellet; P3, light membrane pellet; LP1, lysed synaptosomal membranes; LP2, crude synaptic vesicle fraction; SPM, synaptic plasma membranes; S1, supernatant after synaptosome sedimentation; S3, cytosolic fraction; LS1, supernatant after LP1 sedimentation; LS2, cytosolic synaptosomal fraction. C, Soluble and insoluble pools of Munc13-1 and Munc13-1–EYFP (arrowhead) protein. Brains from WT (+/+) and m/m mice were homogenized by Ultra-Turrax, and soluble (S) and insoluble (P) fractions were separated by ultracentrifugation. Proteins in the soluble and insoluble fractions (10 μg per lane) were analyzed by SDS-PAGE and immunoblotting with antibodies to Munc13-1. Proteins were quantified with the Odyssey imaging system. The ratios between soluble and insoluble Munc13-1/Munc13-1–EYFP were calculated for each mouse and expressed as mean ± SD (n = 3) (bottom panel). D, Munc13-1 and Munc13-1–EYFP mRNA expression. RNase protection assays were performed using RNA from WT (Munc13-1WT) and m/m (Munc13-1–EYFP) and a Munc13-1-specific probe. Munc13-1/Munc13-1–EYFP mRNA levels were normalized to cyclophylin mRNA levels for each mouse and expressed as mean ± SD (n = 3). E, Total Munc13-1 and Munc13-1–EYFP (arrowhead) protein levels. Homogenates from WT (+/+) and m/m mouse brains were analyzed by SDS-PAGE (15 μg of protein per lane) and Western blotting with antibodies to the indicated proteins. Proteins were quantified with the Odyssey imaging system. Munc13-1/Munc13-1–EYFP protein levels were normalized to β-tubulin protein levels for each mouse and expressed as mean ± SD (n = 3) (bottom panel). Note that Munc13-1 protein levels in homozygous WT mice (Munc13-1WT) and Munc13-1–EYFP protein levels in homozygous m/m mice (Munc13-1–EYFP) are almost identical.
Figure 3.
Figure 3.
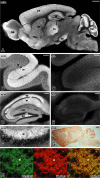
Regional, cellular, and subcellular localization of Munc13-1–EYFP in Munc13-1–EYFP KI brains. A, Overview of direct Munc13-1–EYFP fluorescence in a sagittal section from a paraformaldehyde-fixed m/m mouse brain. Cer, Cerebellum; Co, cortex; Hi, hippocampus; OB, olfactory bulb; Sn, substantia nigra; St, striatum; Th, thalamus. Scale bar, 1 mm. B, C, Higher-resolution images of direct Munc13-1–EYFP fluorescence in sections through the cerebellum of m/m (B) and WT (+/+) mice (C). g, Granule cell layer; m, molecular layer; p, Purkinje cell layer. Scale bars, 100 μm. D, E, Higher-resolution images of direct Munc13-1–EYFP fluorescence in sections through the hippocampus of m/m (D) and WT (+/+) mice (E). hil, Hilus; sg, stratum granulosum; sl, stratum lucidum; sm, stratum moleculare; so, stratum oriens; sp, stratum pyramidale; sr, stratum radiatum. Scale bars, 200 μm. F, High-resolution image of direct Munc13-1–EYFP fluorescence in CA3 region of the hippocampus of an m/m mouse. sl, Stratum lucidum; sp, stratum pyramidale. Scale bar, 25 μm. G, Sagittal section through the brain of a WT mouse stained for Munc13-1 using HRP-coupled secondary antibodies and 3,3′-diaminobenzidine (DAB). Note the similarity between this Munc13-1 immunostaining and direct Munc13-1–EYFP fluorescence (A). Scale bar, 1 mm. H, Images of sections through the CA3 region of the hippocampus of an m/m mouse after fluorescence immunostaining for the active zone marker Bassoon (red). Note the coincidence (yellow) of direct Munc13-1–EYFP fluorescence (green) and Bassoon-positive structures (red) in mossy fiber terminals of the stratum lucidum (sl). Scale bar, 10 μm.
Figure 4.
Figure 4.
Transmitter release in Munc13-1–EYFP KI neurons. A, Sample traces (top panel) and average evoked EPSC amplitudes (bottom panel) in WT and m/m (Munc13-1–EYFP) neurons. For each cell, EPSC amplitudes of 13–20 pulses at 0.2 Hz were averaged. Data are expressed as mean ± SEM. B, Sample traces of RRP measurements (top panel) and average RRP sizes in WT and m/m neurons (Munc13-1–EYFP) (bottom panel). Cells were stimulated with hypertonic sucrose solutions as described in the text. Data are expressed as mean ± SEM. C, Average Pvr in WT and m/m neurons (Munc13-1–EYFP). Pvr was calculated as described in Results. Data are expressed as mean ± SEM. D, Sample traces (top panels) of evoked EPSCs in WT and m/m (Munc13-1–EYFP) neurons before (black traces) and after (gray traces) treatment with 1 μm PDBu, and average PDBu-induced potentiation of evoked EPSCs in WT and m/m (Munc13-1–EYFP) neurons (bottom panel). Data are expressed as mean ± SEM. E, Short-term plasticity of EPSCs in WT (black; WT; n = 18) and m/m (gray; Munc13-1–EYFP; n = 16) neurons during a 10 Hz stimulation train. Neurons were initially stimulated at 0.2 Hz stimulation frequency (data not shown), and then a 10 Hz train was applied for 5 s. EPSC amplitudes were normalized to the average EPSC amplitude of the first nine data points at 0.2 Hz stimulation frequency. Data are expressed as mean ± SEM. F, Short-term plasticity of EPSCs in WT (filled circles; WT; n = 18) and m/m (open squares; Munc13-1–EYFP; n = 16) neurons during 50 Hz stimulation. Neurons were initially stimulated at 0.2 Hz stimulation frequency (data not shown), and then a 50 Hz train of five stimuli was applied. EPSC amplitudes were normalized to the average EPSC amplitude of the first nine data points at 0.2 Hz stimulation frequency. Data are expressed as mean ± SEM.
Figure 5.
Figure 5.
Presynaptic localization of Munc13-1–EYFP in primary cultures of Munc13-1–EYFP KI neurons. A, DIC image of hippocampal neurons obtained from Munc13-1–EYFP KI and grown in culture for 17 d. B, Fluorescence image of Munc13-1–EYFP puncta in the same field of view. C, Fluorescence image overlaid onto DIC image. DF, Higher magnification of Munc13-1–EYFP puncta overlaid onto DIC image of the same region. G, H, Same region as in DF after functional presynaptic sites were labeled with FM4-64 by stimulating the neurons to fire action potentials (60 s at 10 Hz) in the presence of the dye (G), and after unloading the dye (H) with a second train of action potentials (120 s at 10 Hz). I, Combined image of Munc13-1–EYFP (D) and FM4-64 (G). Note the high spatial correspondence between Munc13-1–EYFP and FM4-64 puncta. JL, Neurons fixed and immunolabeled for Piccolo. Note the nearly perfect match between Munc13-1–EYFP- and Piccolo-immunopositive puncta. M, Correlation between the intensity of Munc13-1–EYFP fluorescence and the anti-Piccolo immunofluorescence for the same puncta (1861 puncta). NQ, Neurons double labeled for VGluT1/2 (blue) and VIAAT (red) and imaged for direct Munc13-1–EYFP fluorescence (green). Munc13-1–EYFP colocalizes with VGluT1/2 (filled blue arrowheads) and VIAAT (filled red arrowheads). Only very few VGluT1/2- or VIAAT-positive synapses appear to contain very little or no Munc13-1–EYFP (examples are indicated by open blue and red arrowheads). Scale bars: AC, 20 μm; DI, 5 μm; JQ, 10 μm.
Figure 6.
Figure 6.
Effects of proteasomal protein degradation on steady-state Munc13-1–EYFP levels. A, Fluorescence image of Munc13-1–EYFP puncta in cultured neurons isolated from the cerebral cortex of Munc13-1–EYFP mice. Scale bar, 10 μm. B, Higher magnification of the region enclosed by a rectangle in A. After obtaining the first image, MG132, a potent inhibitor of proteasomal protein degradation, was added to the extracellular medium, and images were collected at 2 h intervals. Only four of nine images collected in this experiment are shown here. C, Mean Munc13-1–EYFP puncta fluorescence over time. Because of gradual changes in the positions of individual puncta over the long durations of these experiments, it was difficult to track individual puncta reliably over the entire experiment. We thus determined programmatically the average fluorescence intensity of all Munc13-1–EYFP puncta in each field of view and normalized these values by dividing them by the average puncta fluorescence for that field of view at time t = 0. Note that no overall increases in Munc13-1–EYFP fluorescence were observed [3 separate experiments; 15 fields of view; 6112 puncta (mean total count)]. Error bars indicate SD.
Figure 7.
Figure 7.
Exchange kinetics of Munc13-1–EYFP at individual presynaptic sites. A, Small field of view enclosing three Munc13-1–EYFP puncta. At time t = 0, one of these puncta (arrow) was selectively photobleached by high-intensity laser light. Fluorescence recovery at these sites was then followed by time-lapse imaging at increasingly longer time intervals (as explained in Results). B, At the end of the experiment, presynaptic boutons were labeled (load) with FM4-64 (60 s at 10 Hz) followed by unloading (120 s at 10 hz) to verify the functionality of the photobleached presynaptic site (bottom panels). Note that the photobleached Munc13-1–EYFP punctum exhibited a capacity for evoked endocytosis and exocytosis of FM4-64. Only puncta that exhibited such a capacity were included in our analysis. Times are given in minutes from photobleaching. Scale bar, 3 μm. C, Munc13-1–EYFP fluorescence recovery curves. All experiments were performed in the presence of CNQX (10 μm) and AP-5 (50 μm) to minimize spontaneous activity. In some of the experiments, neurons were stimulated at 20 Hz for 20 s every 3 min, with stimulation starting immediately after collecting the first post-photobleach image (Stimulated; n = 9), whereas in the remainder, no stimulation was performed (n = 14). Data shown are mean ± SD for all photobleached puncta after correcting for ongoing photobleaching and normalization as described in Materials and Methods. Only one-sided error bars are shown for clarity. D, Munc13-1–EYFP fluorescence recovery curves in neurons grown for 4–8 d in CNQX and AP-5. After performing an initial set of FRAP experiments (Blocked; n = 14) a second set of FRAP experiments was performed in the same preparations (Blocked+Stim; n = 7) while stimulating the neurons during the recovery phase as described in C. E, Comparison of best-fit recovery functions for all conditions. Note that recovery kinetics in all conditions were very similar except those measured after prolonged activity blockade (Blocked). FH, Values of time constants of fast (F) and slow (G) pools and relative pool sizes (H) that provide the best fits for the FRAP experimental data in C and D and that were used to generate the curves shown in CE.

References

    1. Adesnik H, Nicoll RA, England PM. Photoinactivation of native AMPA receptors reveals their real-time trafficking. Neuron. 2005;48:977–985. - PubMed
    1. Aravamudan B, Broadie K. Synaptic Drosophila UNC-13 is regulated by antagonistic G-protein pathways via a proteasome-dependent degradation mechanism. J Neurobiol. 2003;54:417–438. - PubMed
    1. Augustin I, Betz A, Herrmann C, Jo T, Brose N. Differential expression of two novel Munc13 proteins in rat brain. Biochem J. 1999a;337:363–371. - PMC - PubMed
    1. Augustin I, Rosenmund C, Südhof TC, Brose N. Munc13-1 is essential for fusion competence of glutamatergic synaptic vesicles. Nature. 1999b;400:457–461. - PubMed
    1. Betz A, Okamoto M, Benseler F, Brose N. Direct interaction of the rat unc-13 homologue Munc13-1 with the N terminus of syntaxin. J Biol Chem. 1997;272:2520–2526. - PubMed

Publication types

MeSH terms

LinkOut - more resources